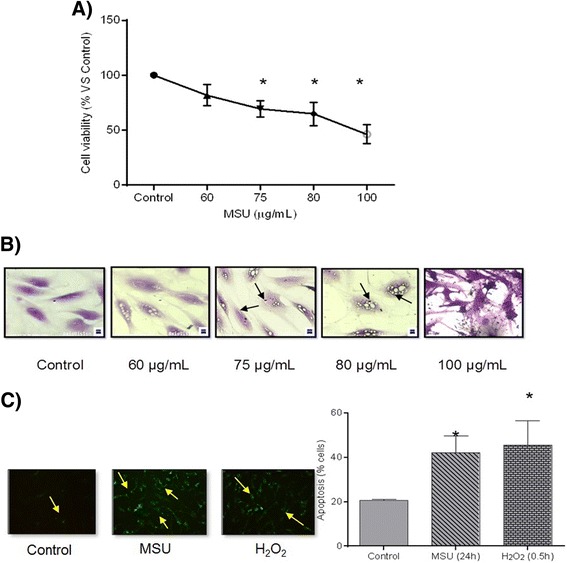
Fig. 1.

Cellular response to the presence of monosodium urate (MSU) crystals. a Cell viability after a 24 h treatment. b Cell morphological changes after MSU crystal exposure. The arrows indicate the intracellular vacuoles of MSU crystals. c Apoptosis is revealed by Annexin V detection (yellow arrows) in synoviocytes exposed to MSU crystals and H2O2 (100 μM). Additionally, columns show quantification of the apoptotic cells by flow cytometry. Values are expressed as the mean ± standard deviation *P < 0.05 vs control
