Fig. 3.

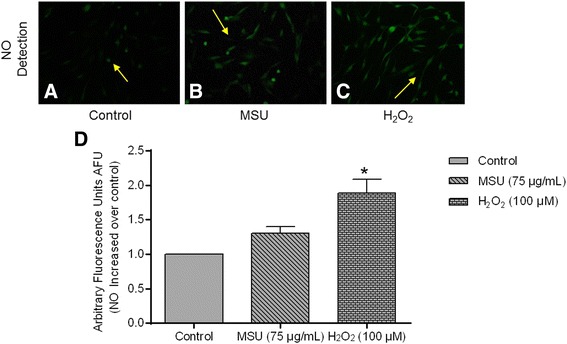
Nitric oxide (NO) production in synoviocytes. a Detection of NO in untreated fibroblast-like synoviocytes (FLS). b FLS treated with monosodium urate (MSU) crystals. c FLS treated with H2O2. Arrows indicate fluorescence produced by intracellular NO. d Bars show NO quantification by Tali image-based cytometer. Values are expressed as the mean ± standard deviation; *P < 0.05 vs control
