
Fig. 3.
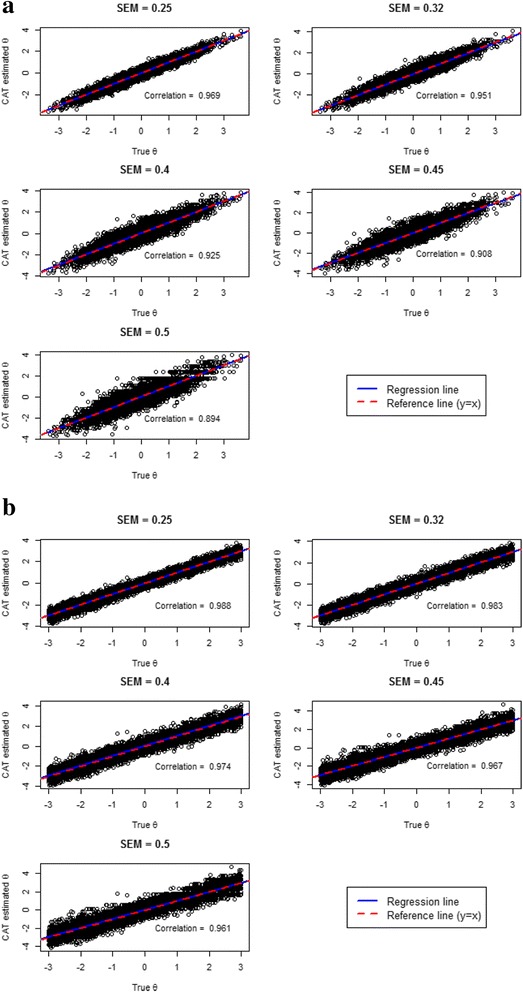
Scatterplots and correlations between CAT estimated θs and true θs for a) θ true ~ N(0,1) and b) θ true ~ U(-3,3)
Official websites use .gov
A
.gov website belongs to an official
government organization in the United States.
Secure .gov websites use HTTPS
A lock (
) or https:// means you've safely
connected to the .gov website. Share sensitive
information only on official, secure websites.
Scatterplots and correlations between CAT estimated θs and true θs for a) θ true ~ N(0,1) and b) θ true ~ U(-3,3)