
Fig. 7.
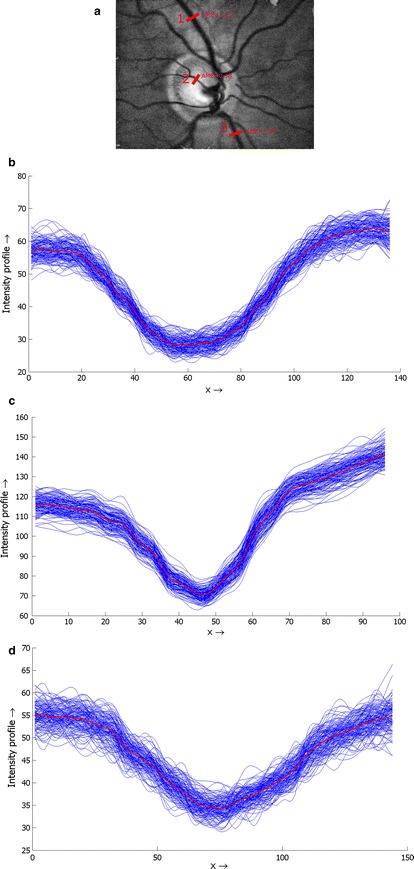
An example of the line profile selection (a) and real profile curves corresponding with position 1 (b), 2 (c) and 3 (d), together with the mean curve (red)
Official websites use .gov
A
.gov website belongs to an official
government organization in the United States.
Secure .gov websites use HTTPS
A lock (
) or https:// means you've safely
connected to the .gov website. Share sensitive
information only on official, secure websites.
An example of the line profile selection (a) and real profile curves corresponding with position 1 (b), 2 (c) and 3 (d), together with the mean curve (red)