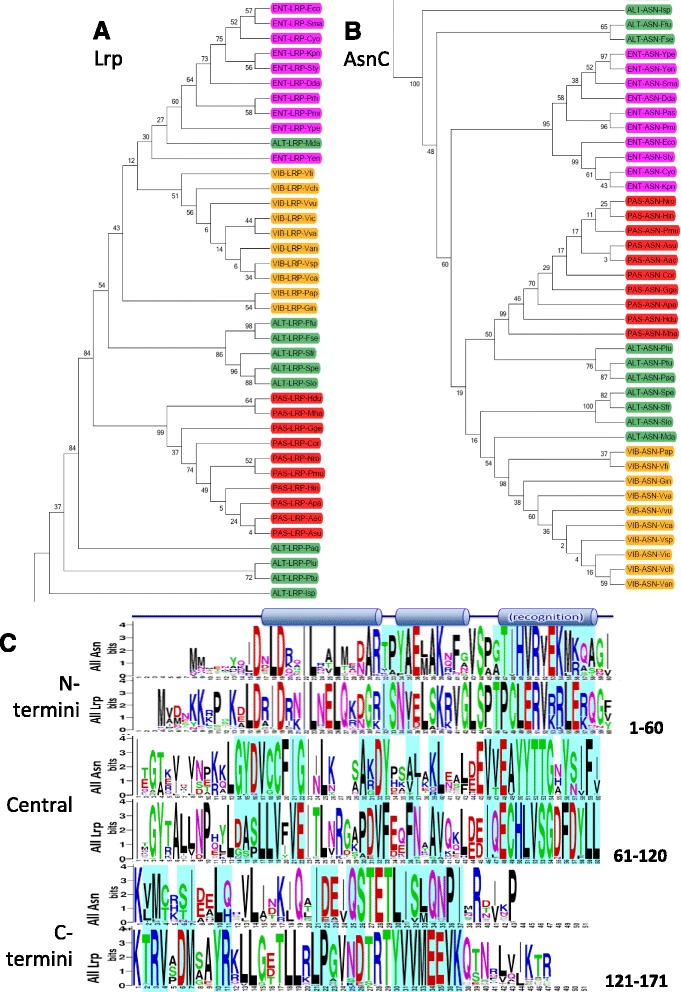
Fig. 2.

Phylogeny and comparison of the paralogs Lrp and AsnC. Maximum likelihood phylogeny was constructed using the a Lrp and b AsnC protein sequences. The numbers above or below the internal branches show bootstrap values (%). Color keys indicate the different orders: magenta = Enterobacteriales (Ent), orange = Vibrionales (Vib), green = Alteromandales (Alt), red = Pasteurellales (Pas). c Logo comparison of all 40 Lrp vs. all 40 AsnC sequences. Areas visually identified as showing conserved differences are shaded in cyan
