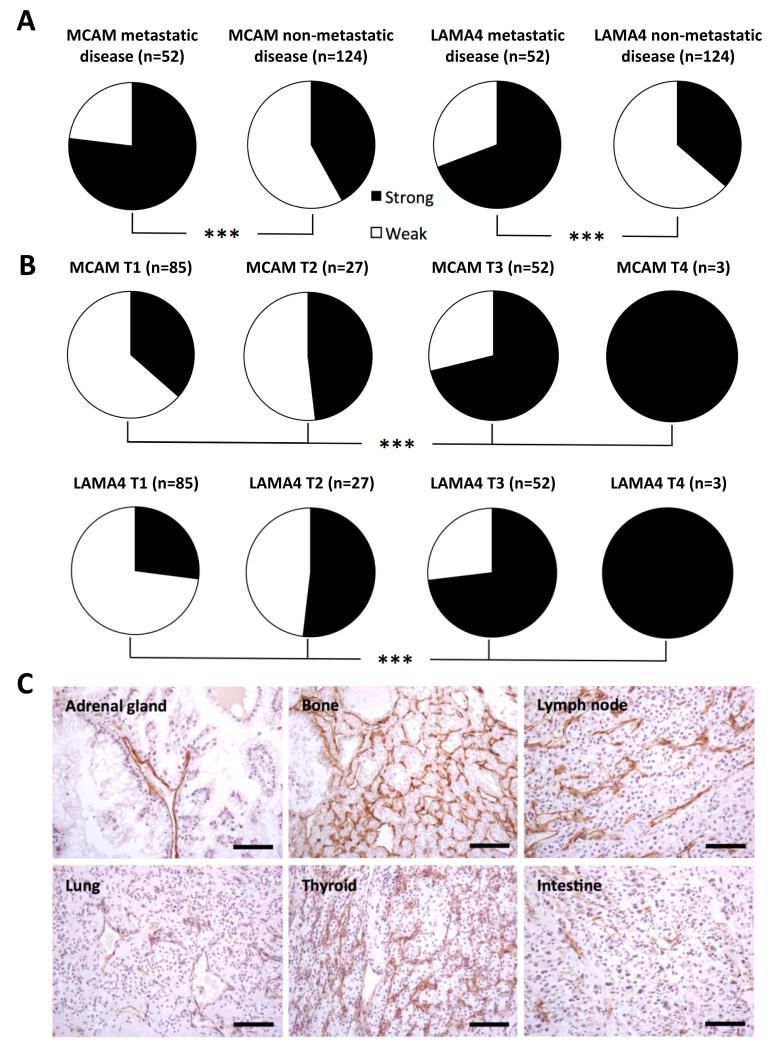
Figure 4.
MCAM and LAMA4 expression is enhanced in metastatic and locally advanced clear cell RCC. A, pie-chart proportional representation of strong (black) vs. weak (white) marker expression in metastatic and non-metastatic RCC, determined by IHC on RCC cohorts 1,2 and 3. Statistical analysis: chi-square, *** p<0.001. B, pie-chart proportional representation of strong (black) vs. weak (white) marker expression at different RCC T-stages, determined by IHC on RCC cohorts 1,2 and 3. Statistical analysis: chi-Square, *** p<0.001. C, representative images of MCAM staining in clear cell RCC metastases to various organs, generated by IHC. Scale bar = 50 μm.

