Figure 1.
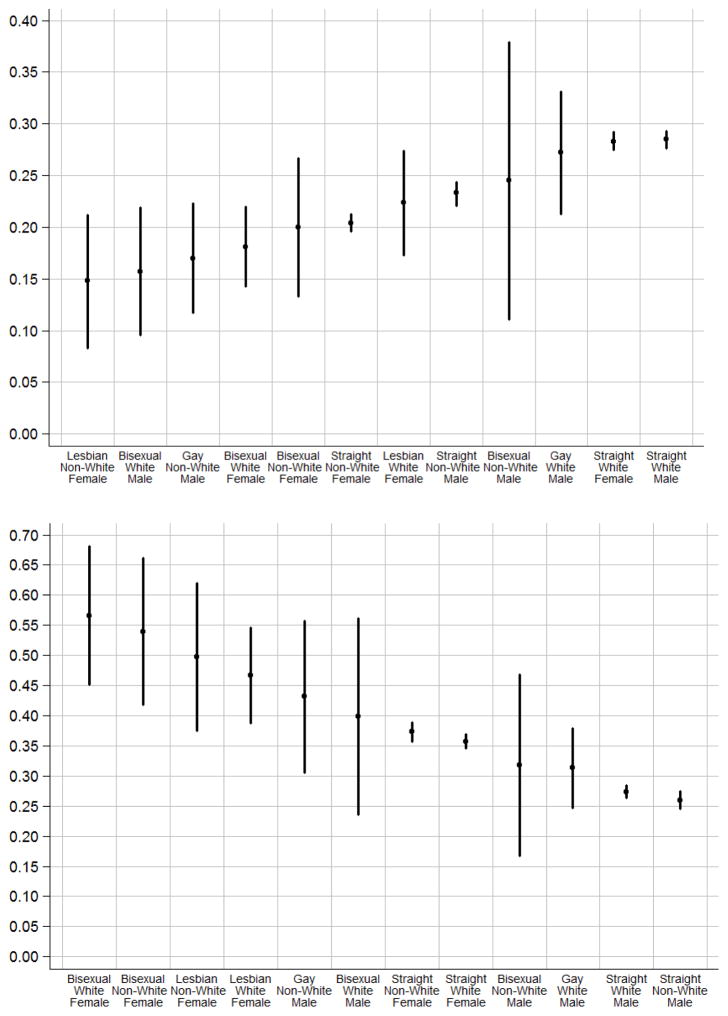
Figure 1A. Probability of reporting excellent self-rated health, conditional on sociodemographic characteristics, by gender, race, and sexual identity.
Note: Circles indicate point estimates. Lines represent 95% confidence intervals.
Figure 1B. Probability of reporting any functional limitation, conditional on sociodemographic characteristics, by gender, race, and sexual identity.
Note: Circles indicate point estimates. Lines represent 95% confidence intervals.

