Fig. 4.
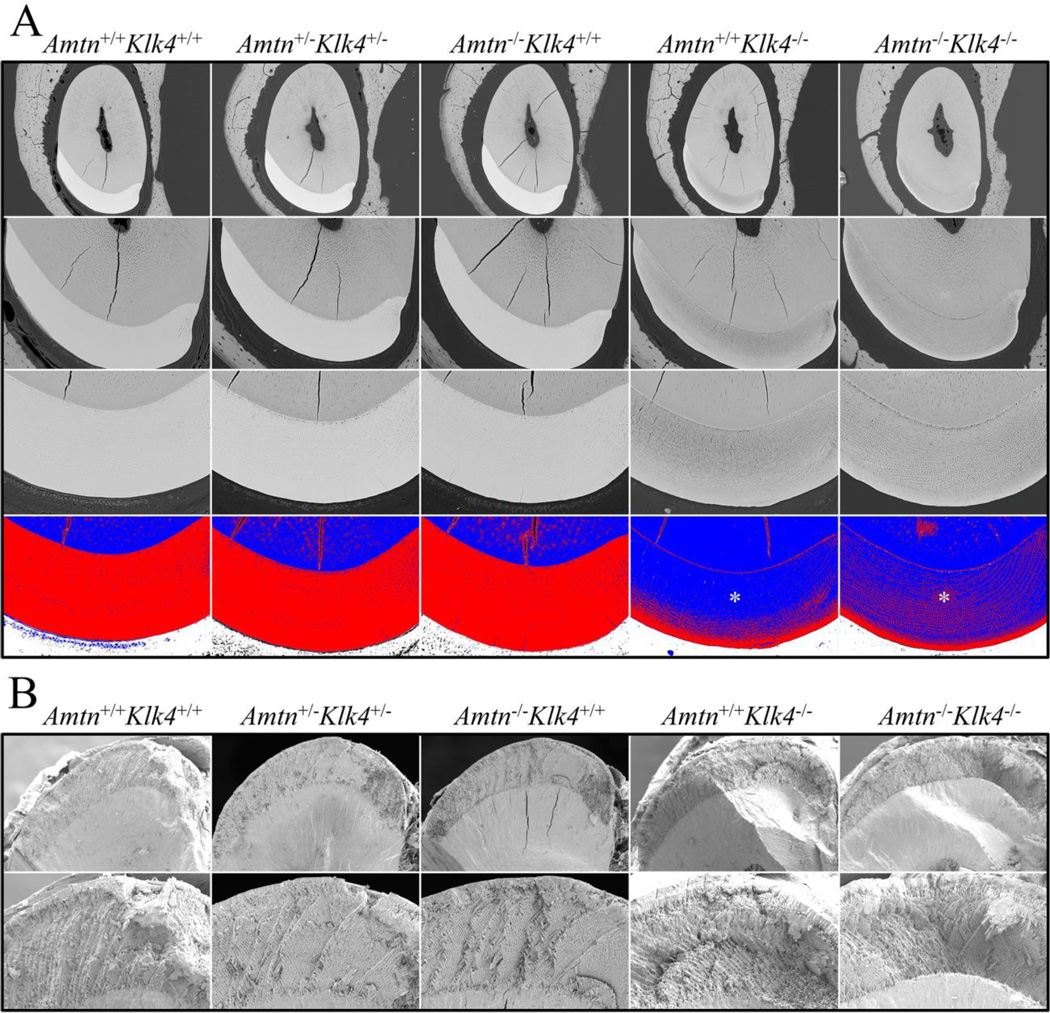
7-Week Mandibular Incisor Cross-Sections at the Level of the Alveolar Crest. A: Backscattered scanning electron micrographs (bSEMs) of polished surfaces at 200X (top row) and 500X (second and third rows) magnifications. Images such as these were used to measure the thickness of the enamel layer (which was the same in all genotypes) and to assess the degree of enamel mineralization (lighter is more highly mineralized than darker gray). In row 3 pseudocolorization of bSEM images using ImageJ (Red is above threshold; blue is below threshold) emphasizes the similar degree of enamel mineralization in the Amtn+/+Klk4+/+Amtn+/−Klk4+/−, and Amtn−/−Klk4+/+ mice, and the decreasing level of enamel mineralization with depth (toward the DEJ) in the Amtn+/+Klk4−/− and Amtn−/−Klk4−/− mice (asterisks). B: SEM images of the enamel layer fractured at the level of the alveolar crest. Images such as these were used to assess the pattern of enamel rod decussation. The enamel rods in alternative rows showed the familiar X (decussation) pattern in all genotypes.

