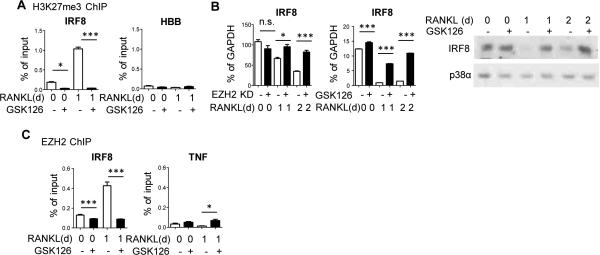
Figure 2. EZH2 directly silences IRF8 expression.
A. ChIP assays for H3K27me3 at the IRF8 or negative control HBB promoter in cells pretreated with GSK126 or DMSO and stimulated with RANKL. Data are shown as mean ± SEM of triplicates from one representative experiment. Pooled data (N = 4) was analyzed using repeated measures one-way ANOVA with post hoc Tukey test. *P <0.05; *** P <0.005.
B. IRF8 mRNA expression in RANKL-stimulated EZH2 knockdown and control cells (left panel) or GSK126 treated cells (center panel) and IRF8 protein expression in GSK126 treated cells stimulated with RANKL (right panel). PCR data is shown as mean ± SEM of triplicates from one experiment; N = 3. This figure shows data from representative experiments. Statistical testing was then applied to the representative data (one-way ANOVA with post hoc Tukey test). *P <0.05; ** P <0.01; *** P <0.005, n.s=not significant.
Blots shown are representative; N = 3.
C. ChIP assays for EZH2 at the IRF8 or negative control TNF promoter in cells pretreated with GSK126 or DMSO and stimulated with RANKL. Data shown as mean ± SEM of triplicates from one representative experiment; N=4. Statistics were performed as in B. *P <0.05; *** P <0.005.

