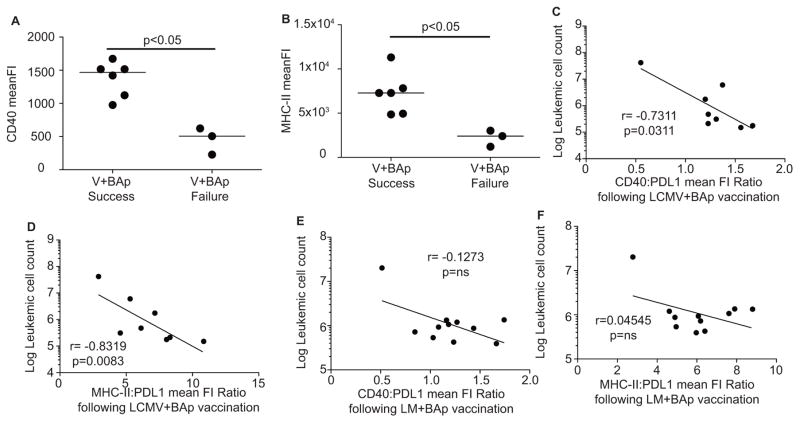
Figure 5. Prophylactic vaccination induces antigen presentation and costimulation on leukemic cells.
A. Mice were vaccinated with LCMV+BAp and inoculated with leukemia 30 days later. CD40 Mean Fluorescence Intensity from leukemic cells harvested from Successful vaccinated mice or Failed vaccinated mice derived from Figure 4C. Mann-Whitney U Test used to establish significance. B. MHC-II Mean Fluorescence Intensity from leukemic cells harvested from Successful vaccinated mice or Failed Vaccinated mice. Mann-Whitney U test used to establish significance. C. Ratio of Mean Fluorescence Intensity of CD40:PDL1 on leukemic cells was calculated from mice vaccinated with LCMV+BAp, and a correlation was calculated between this ratio (X-axis) and the log leukemic cell count (Y-axis). D. Ratio of Mean Fluorescence Intensity of MHC-II: PDL1 on leukemic cells was calculated from mice vaccinated with LCMV+BAp, and a correlation was calculated between this ratio (X-axis) and the log leukemic cell count (Y- axis). E. Ratio of Mean Fluorescence Intensity of CD40: PDL1 on leukemic cells was calculated from mice vaccinated with LM+BAp, and a correlation was calculated between this ratio (X-axis) and the log leukemic cell count (Y-axis). F. Ratio of Mean Fluorescence Intensity of MHC-II: PDL1 on leukemic cells was calculated from mice vaccinated with LM+BAp, and a correlation was calculated between this ratio (X-axis) and the log leukemic cell count (Y-axis). The values on graphs are from the Spearman Correlation test. Two or more independent experiments with 4 or more replicates are shown for each group.

