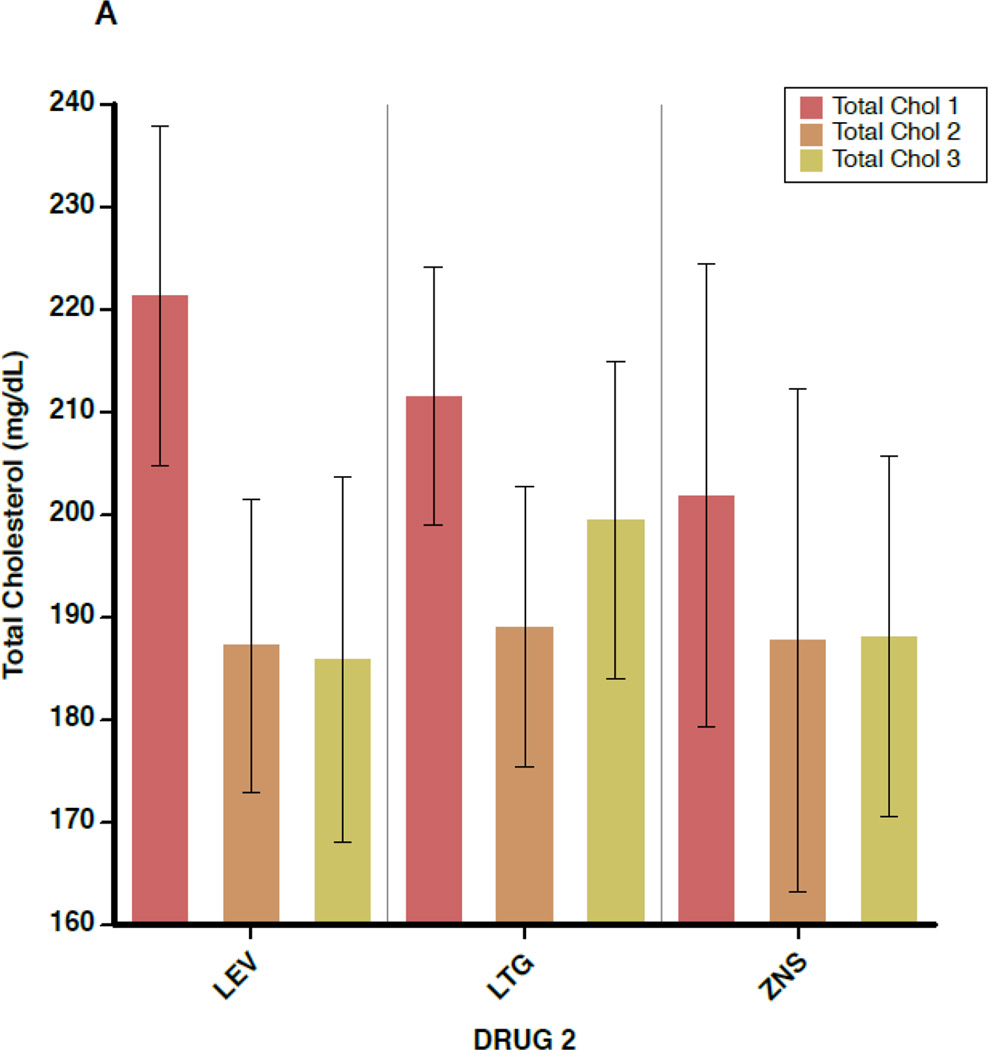
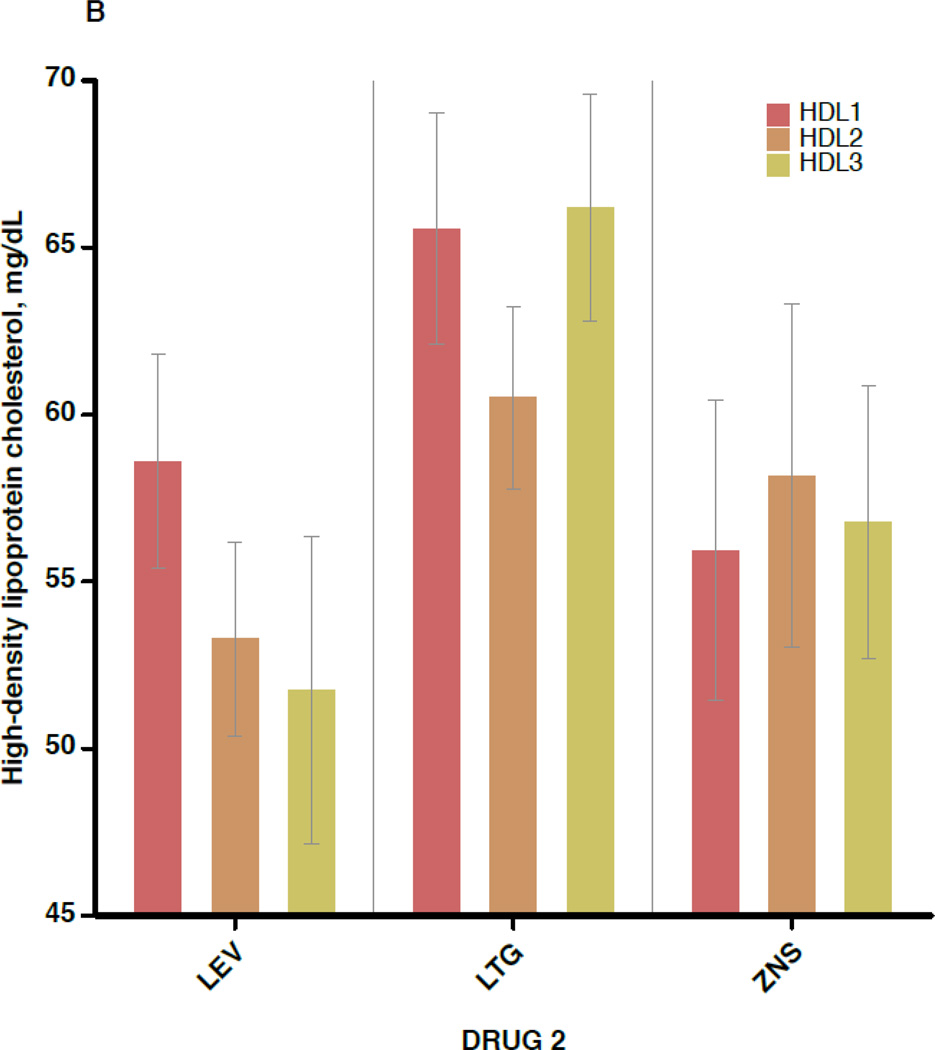
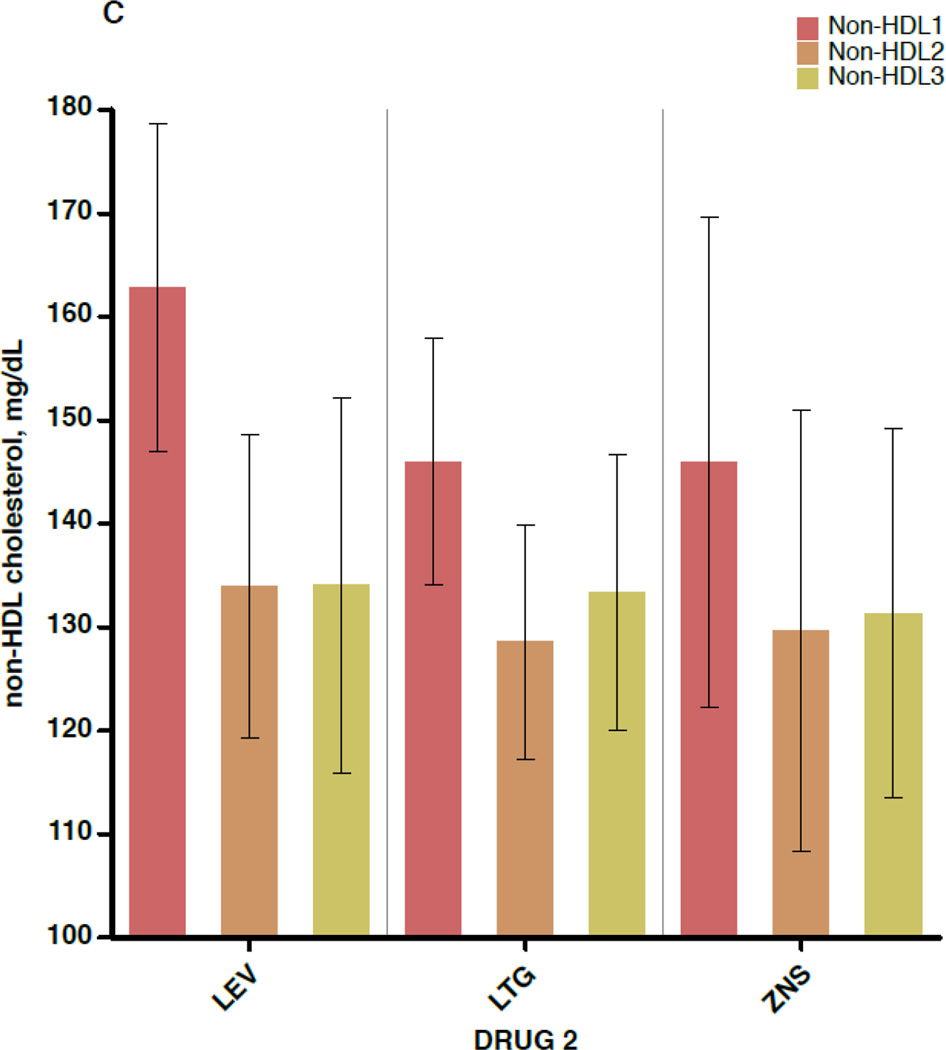
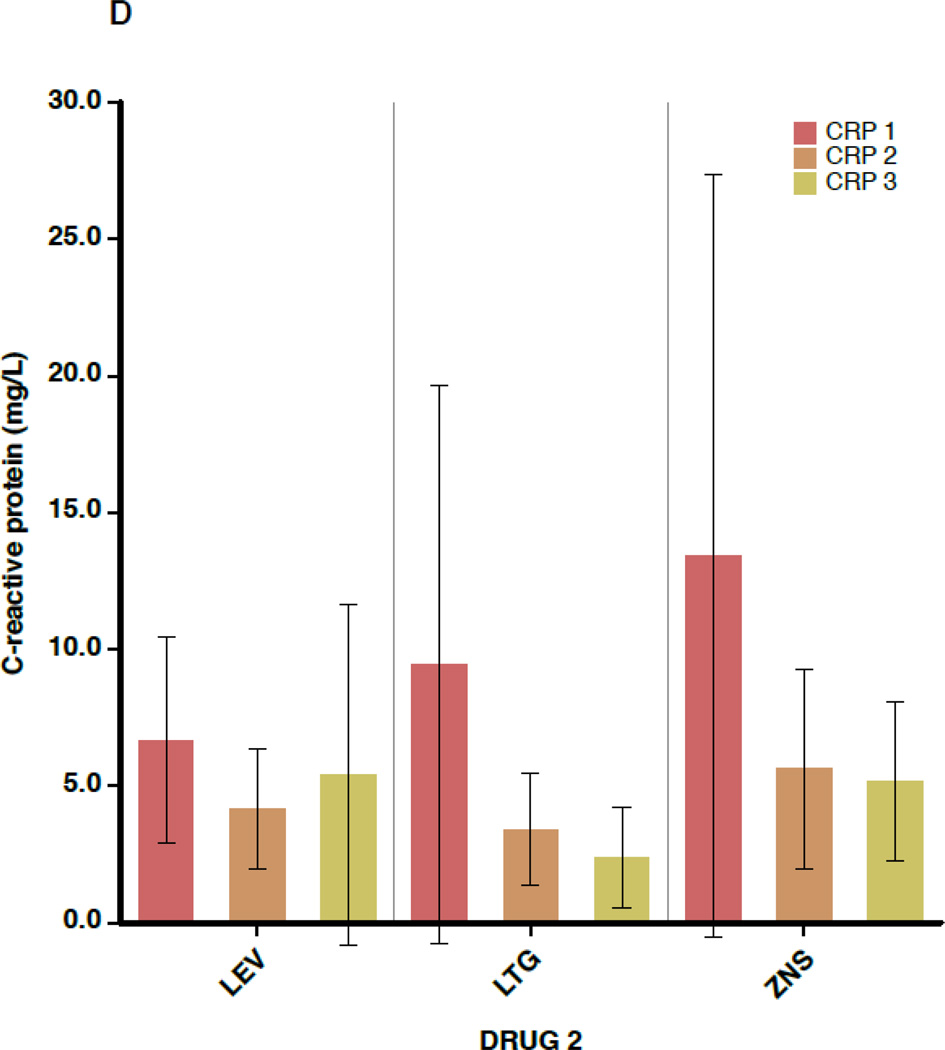
Figure 2.
A–D. Outcome measures for each of the three serologic samples, subdivided by the drug to which the patient was switched (lamotrigine[LTG], levetiracetam[LEV], or zonisamide[ZNS]). Data shown are means and 95% confidence intervals for total cholesterol (A), high-density lipoprotein cholesterol (B), non-high-density lipoprotein cholesterol (C), and C-reactive protein (D). For the LEV patients, n=28 for the first and second sample times and n=11 for the third. For LTG patients, n=30 for the first two samples and n=19 for the third. For ZNS patients, n=17 for the first two and n=16 for the third.


