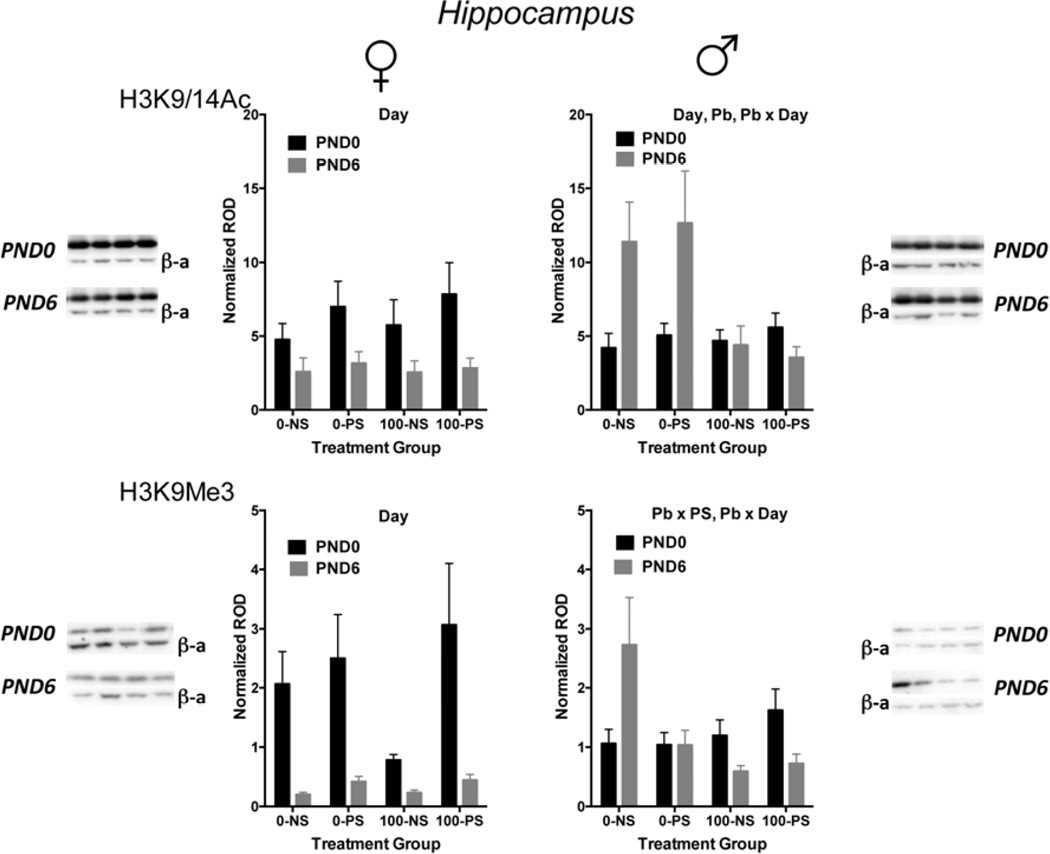
FIGURE 1.
Mean ± S.E. normalized relative optical density (ROD) of H3K9/14Ac (top row) and H3K9Me3 (bottom row) in females (left column) and males (right column) at PND0 (closed circles) and at PND6 (open circles) in hippocampus for each of the indicated treatment groups (0-NS = no Pb, non-stress; 0-PS = no Pb + prenatal stress; 100-NS = 100 ppm Pb, non-stress; 100-PS = 100 ppm Pb + prenatal stress). Sample sizes range from 7–13. Results of statistical analysis: Day=significant main effect of Day, Pb=significant main effect of Pb; PS=significant main effect of PS; Pb × Day=significant interaction of Pb by Day; Pb × PS=significant interaction of Pb by PS. For representative gel images associated with each graph, PND0 is the top set, PND6 is the bottom set. Within each set of gel images, H3K9/14Ac or H3K9Me3 is the top row and the beta actin (β-a) is the bottom row. The lanes are in the same order as the treatment groups on the graph.

