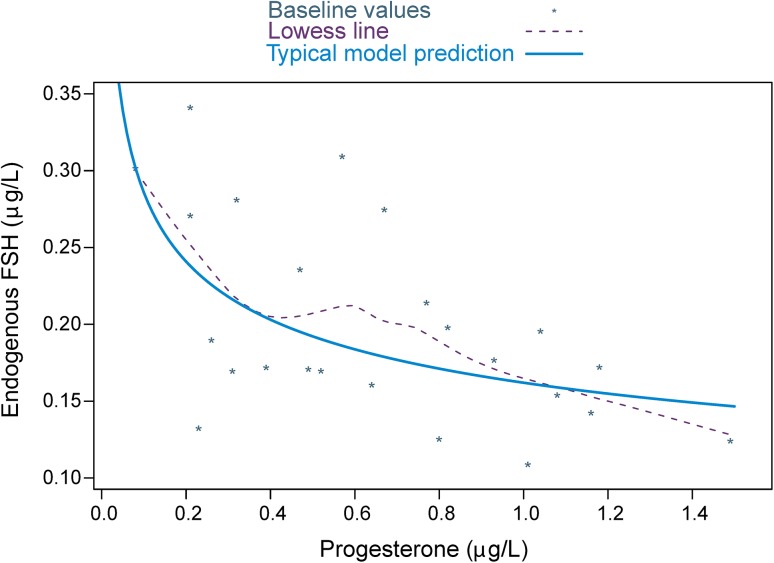
Fig. 2.
The relationship between endogenous FSH and progesterone at baseline. Points are individual-predicted FSHbl values and observed progesterone baseline values with a smooth LOWESS trend line (broken line). The solid line is the power function used in the model describing the typical population relationship for the effect of progesterone baseline at the parameter FSHbl. FSH follicle-stimulating hormone, FSH b1 endogenous FSH baseline

