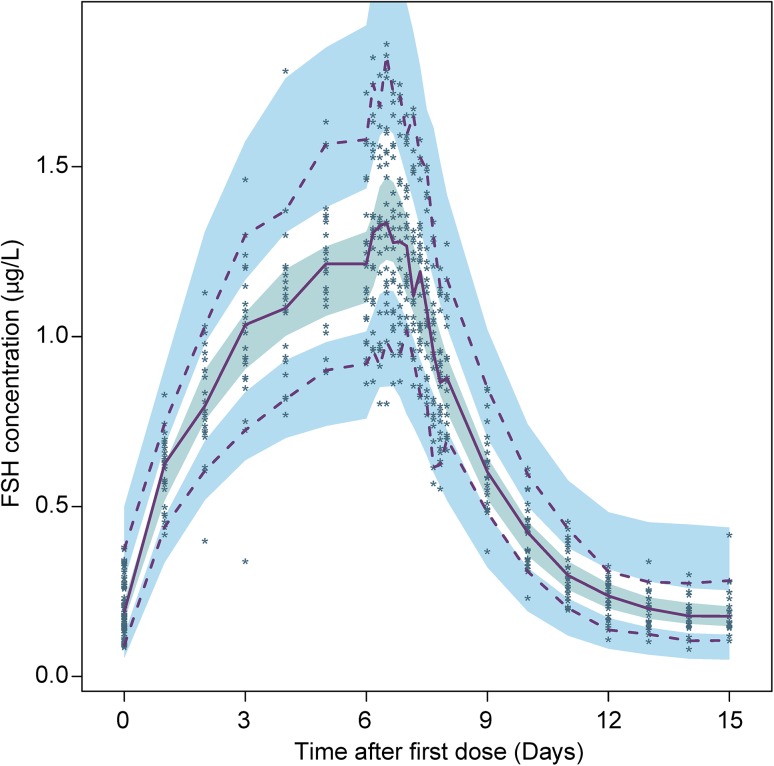
Fig. 3.
Visual predictive check for the final model, showing the individual observed FSH concentrations (points) and the 2.5th, 50th, and 97.5th percentiles of observations (lines). The shaded areas are the 95 % confidence intervals for the 2.5th, 50th, and 97.5th percentiles of the simulations. FSH follicle-stimulating hormone

