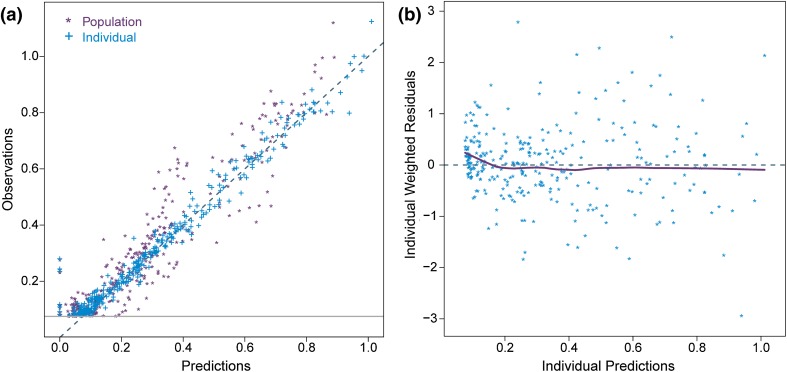
Fig. 3.
Goodness of fit plots. a Observations against population predictions (purple points asterisks) and individual predictions (blue points plus symbol) with the unity line. The grey line represents the LLOQ of 0.075 µg/L. b Individual residuals against individual predictions (points) with a smooth lowess line. LLOQ lower limit of quantification

