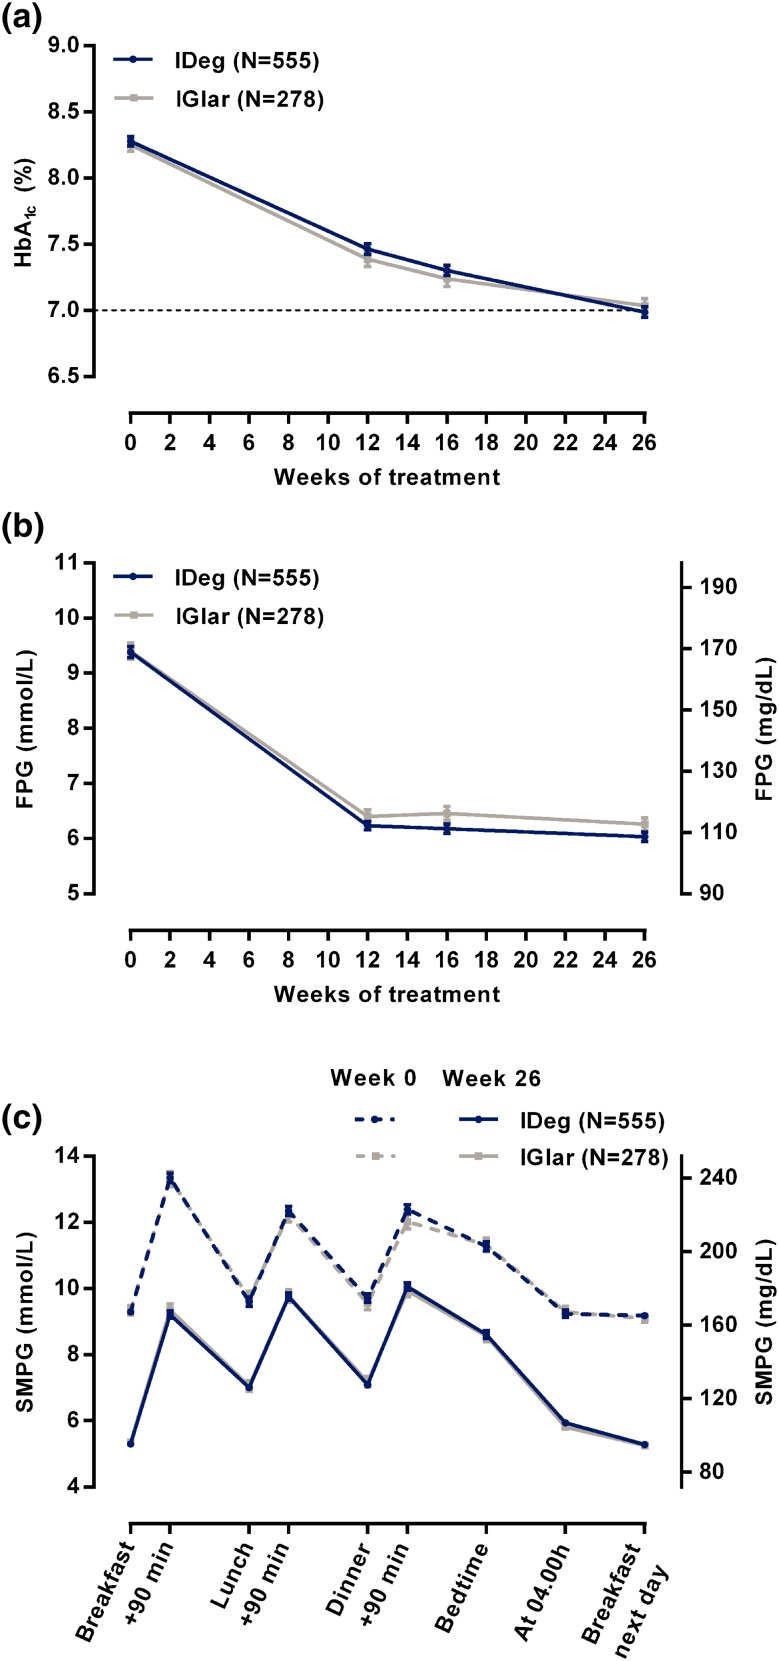
Fig. 2.
Glycemic control (full analysis set). a Mean HbA1c across the 26-week treatment period, b mean FPG across the 26-week treatment period, c 9-point SMPG profiles at baseline (week 0) and end of treatment (week 26). Glucose measurements for 9-point profiles were performed just before a meal and 90 minutes after start of the meal. Data are mean ± SEM. Missing data after baseline are imputed with the last observation carried forward method. IDeg insulin degludec, IGlar insulin glargine, HbA 1c glycosylated hemoglobin, FPG fasting plasma glucose, SMPG self-measured plasma glucose, +90 min 90 min after start of the preceding meal, SEM standard error of the mean

