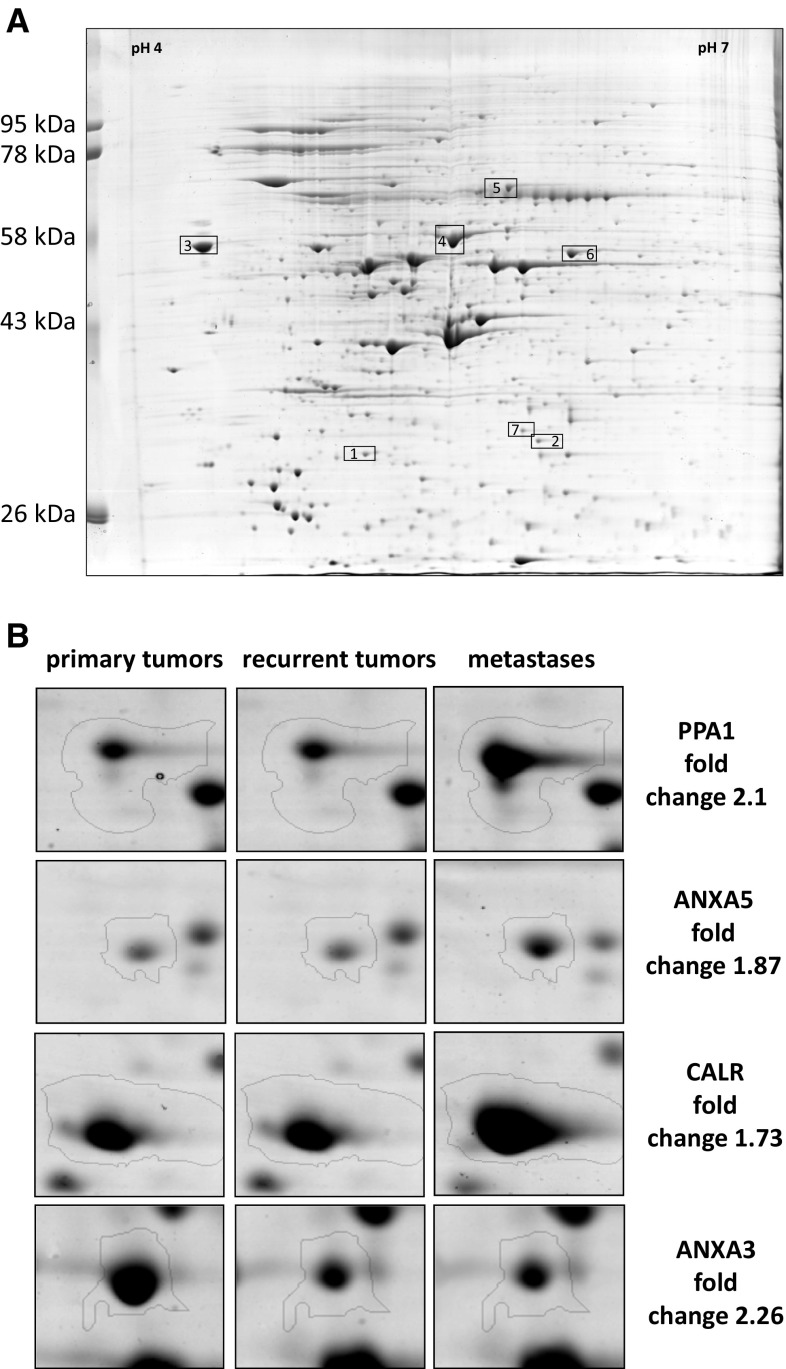
Fig. 1.
a Representative example of the 2D PAGE analysis of primary tumor cell line. IEF was performed in pH 4–7. The proteins showing different abundance identified by mass spectrometry are indexed by numbers and boxed (see Table 1). b Examples of differentially expressed proteins

