Figure 7.

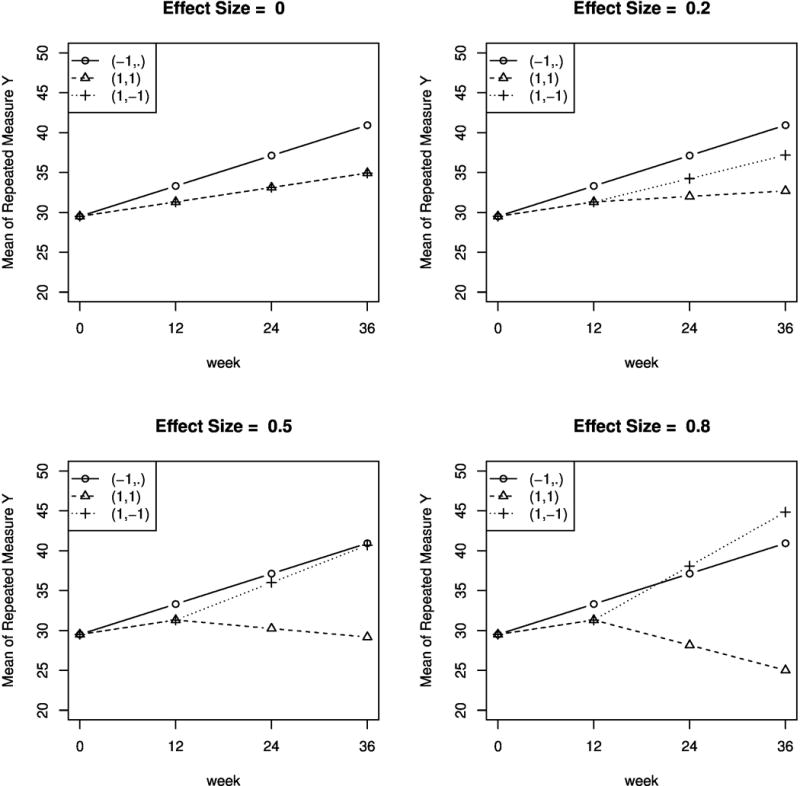
True mean trajectories of the repeated measures under the embedded DTRs, under four data-generative models corresponding to effect size (of the contrast in AUC between DTR (1, 1) and (1, −1)) = 0, 0.2, 0.5, 0.8.

True mean trajectories of the repeated measures under the embedded DTRs, under four data-generative models corresponding to effect size (of the contrast in AUC between DTR (1, 1) and (1, −1)) = 0, 0.2, 0.5, 0.8.