Figure 1.

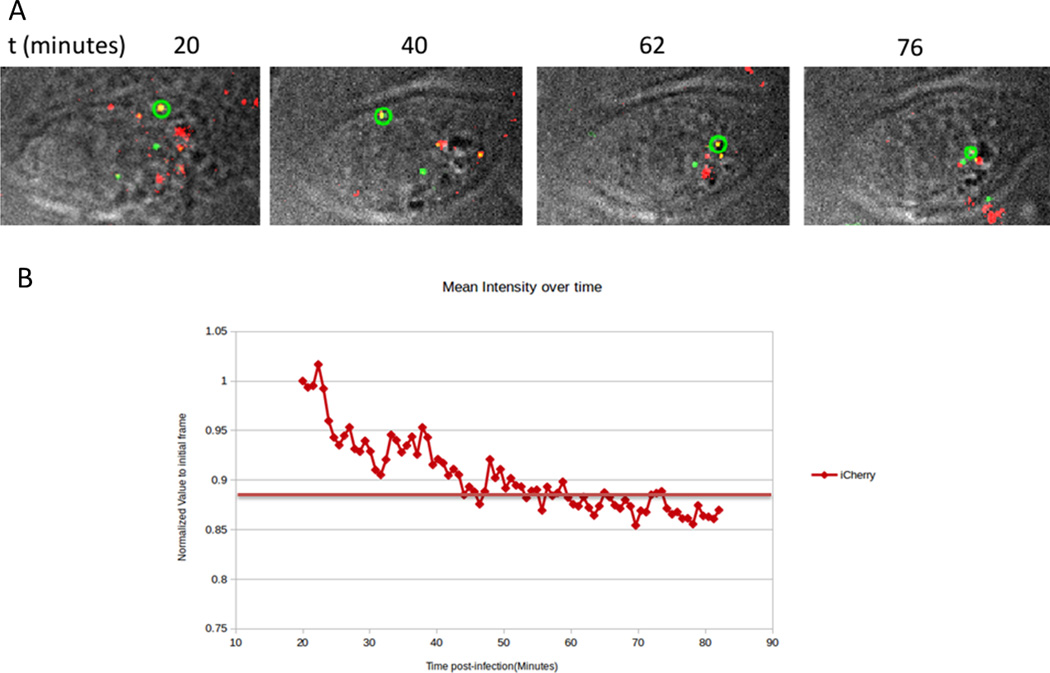
Time-lapse wide-field imaging of dual labeled iCherry/GFP Vpr HIV-1 particles. A. CHO-pgsA-745 cells were imaged for 60 minutes (starting 20 minutes post infection) the snapshots represent different time-points. GFP tagged Vpr (emission at 528nm) is represented in green; iCherry is represented in red (emission at 608nm) and DIC acquisition is represented in gray. The images were Deconvolved and Z-projected operating Softworks software from DeltaVision. The tracked particle of interest is encircled in green B. GFP-Vpr particles were tracked with TrackMate plugin for ImageJ and the mean intensities for the acquisition at 608nm (Cherry) of the particle of interest are represented. An initial fusion event is observed around 22minutes post-infection and a second drop of signal is observed which is believed to be uncoating. Horizontal bar represent the limit of detection to the given wavelength.
