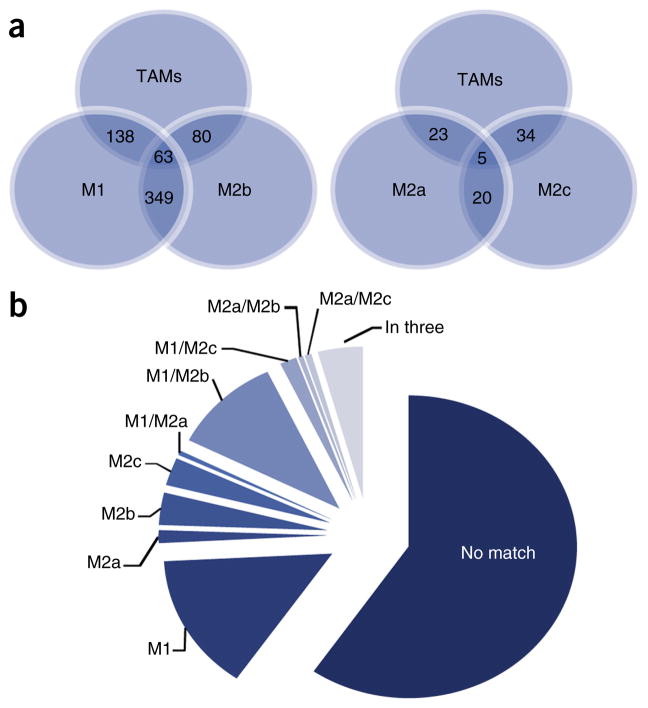
Figure 3.
M1/M2 profile of TMAs. Comparison of TAMs with M1- and M2a-, M2b- and M2c-stimulated macrophage data sets53 (http://www.ebi.ac.uk/arrayexpress/experiments/E-GEOD-32690/) containing macrophages stimulated for 24 h in vitro into different polarization states (M0 (unstimulated), M1 (IFNγ + LPS), M2a (IL4), M2b (IFNγ + complexed Ig) and M2c (dexamethasone)), which were compared with TAMs. (a) A graphical representation of the overlap of upregulated genes in TAMs and the four macrophage data sets. The TAMs gene expression profile shows the greatest overlap with M1- and M2b-polarized macrophages. The number of overlapping genes is indicated. (b) Using Gene Set Enrichment Analysis reveals that only a minority of genes that were upregulated in TAMs were also induced in the M1 to M2c phenotype; 59.5% of the genes upregulated in TAMs were not regulated in any of the four macrophage phenotypes.

