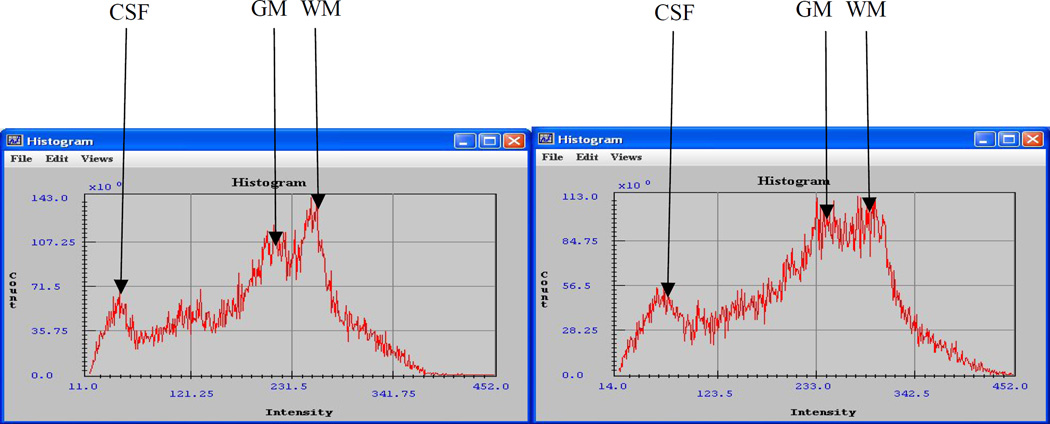
Figure 2.
Skull and fat stripped image signal intensity histograms. a: baseline image signal intensity histogram; b: signal intensity histogram in the presence of fat on the head. Notice the change in vertical scale of the overall signal magnitudes from (143.0 × 10⁶) in a down to (113.0 × 10⁶) in b. Also, notice the horizontal shift of the entire histogram and of its signal maxima

