
Figure 1.
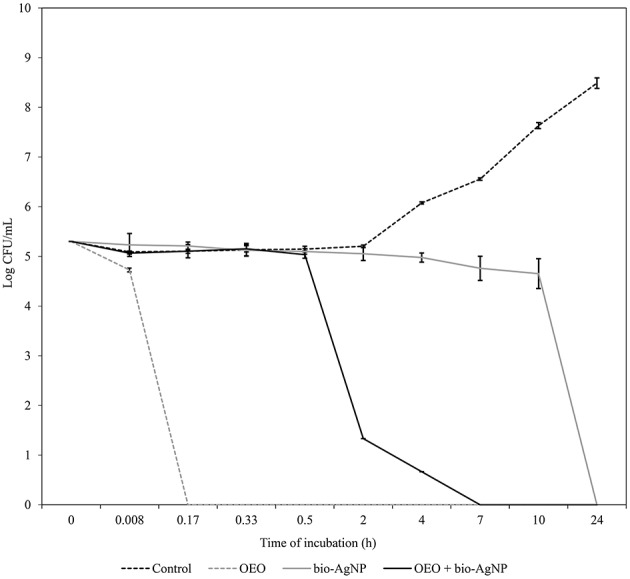
Time-kill curves of S. aureus 25923 (ATCC) exposed to OEO and bio-AgNP individually and in combination at MIC values. Bacteria at 5 × 10⁵ CFU/mL were exposed to three different treatments; OEO alone (0.596 mg/mL), bio-AgNP alone (250μM), and OEO + bio-AgNP (0.298 mg/mL + 125 μM). Control indicates bacterial growth without antimicrobial compounds. Values of CFU/mL are the mean ± standard deviation.