FIGURE 5.
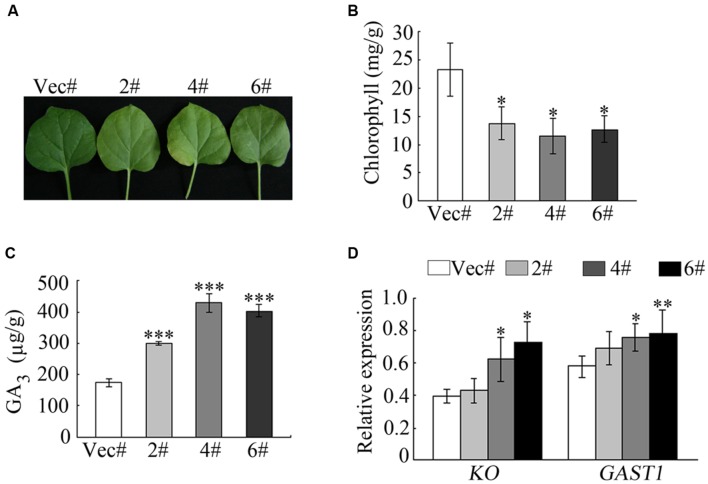
Overexpression of GhMPK11 influences the chlorophyll content. (A) Detached leaves from 8-week-old OE and control plants. (B) The chlorophyll contents of leaves detached from OE and control plants. (C) The GA3 contents in OE and control plant leaves. (D) GA-related genes expression was detected by qRT-PCR. The data are the means ± SD from three independent experiments. The asterisks indicate statistically significant differences between the transgenic and control plants (∗P < 0.05; ∗∗P < 0.01; ∗∗∗P < 0.001, Student’s t-test).

