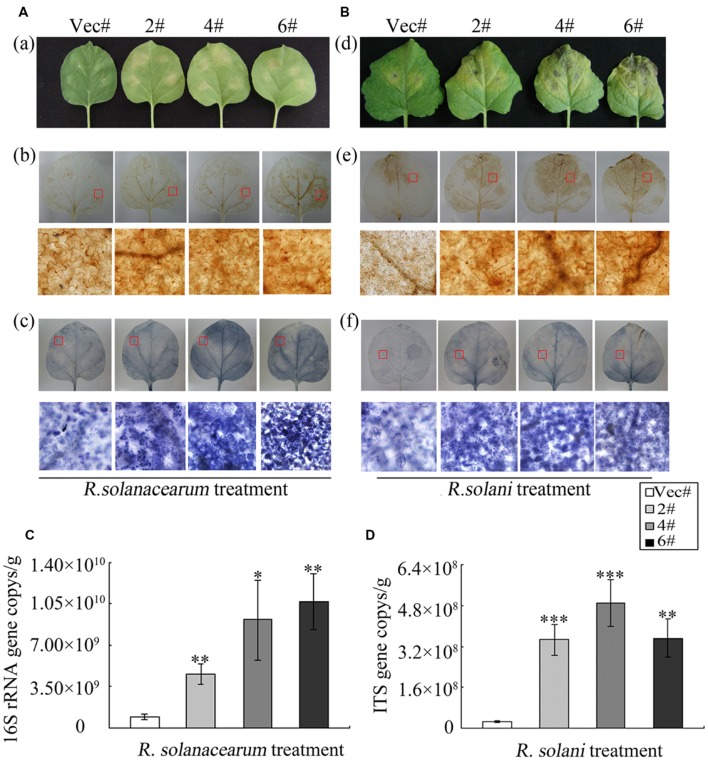
FIGURE 6.
GhMPK11 Overexpression influences the diseases responses of plants.
(A) Leaves infiltrated with R. solanacearum and R. solani
(B). The levels of H2O2 and  in leaves were determined by DAB (a) and NBT (b) staining, respectively. (C,D) Pathogen accumulation after 6 days cultivation determined by qRT-PCR. Data are the mean ± SD from three independent experiments. The asterisks indicate statistically significant differences between the transgenic and control plants (∗P < 0.05; ∗∗P < 0.01; ∗∗∗P < 0.001, Student’s t-test).

