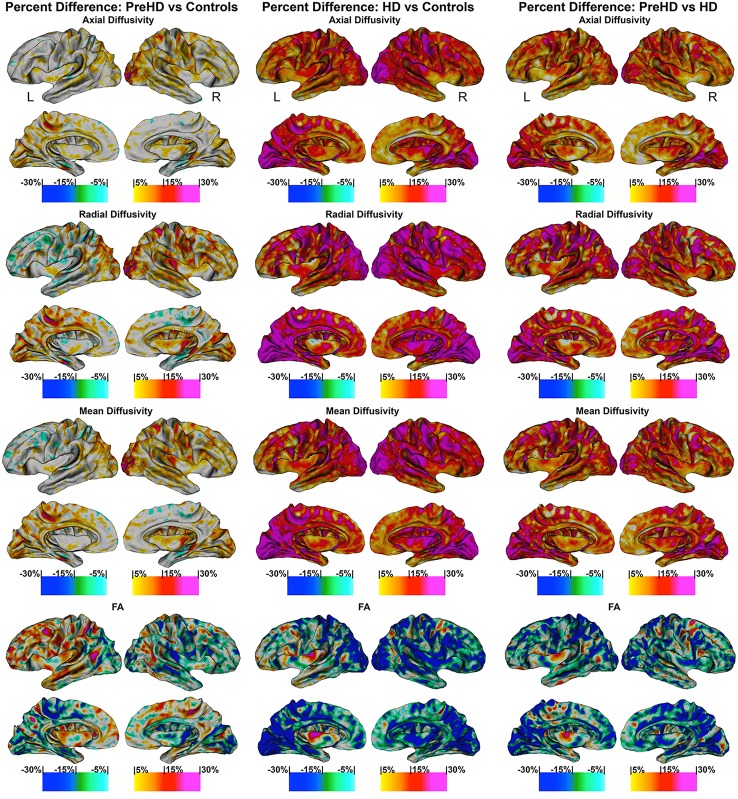
Figure 5.
Percentage change maps: axial, radial, mean diffusivity and fractional anisotropy. Vertex based percentage change maps show the difference between Controls and Pre-HD subjects, Controls and HD patients, and Pre-HD subjects and HD patients superficial white matter axial diffusivity, radial diffusivity, mean diffusivity, and fractional anisotropy at high spatial density. For axial, radial, and mean diffusivity, red colors represent higher diffusivity in Pre-HD subjects and HD and blue colors represents lower diffusivity when compared to controls. For HD patients vs. Pre-HD red colors indicate increased diffusivity for HD patients. For fractional anisotropy, blue colors represent decreased fractional anisotropy for Pre-HD and HD patients compared to controls. For HD patients vs. Pre-HD, blue colors indicate lower fractional anisotropy for HD patients.

