Figure 3.

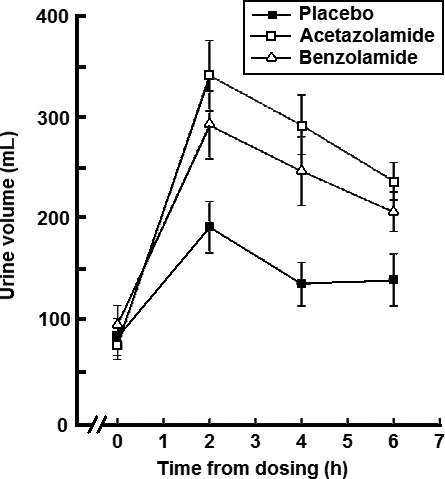
The time courses of urine output after dosing with either placebo, acetazolamide 500 mg, or benzolamide 200 mg. Mean values at each time point are shown ± SEM.

The time courses of urine output after dosing with either placebo, acetazolamide 500 mg, or benzolamide 200 mg. Mean values at each time point are shown ± SEM.