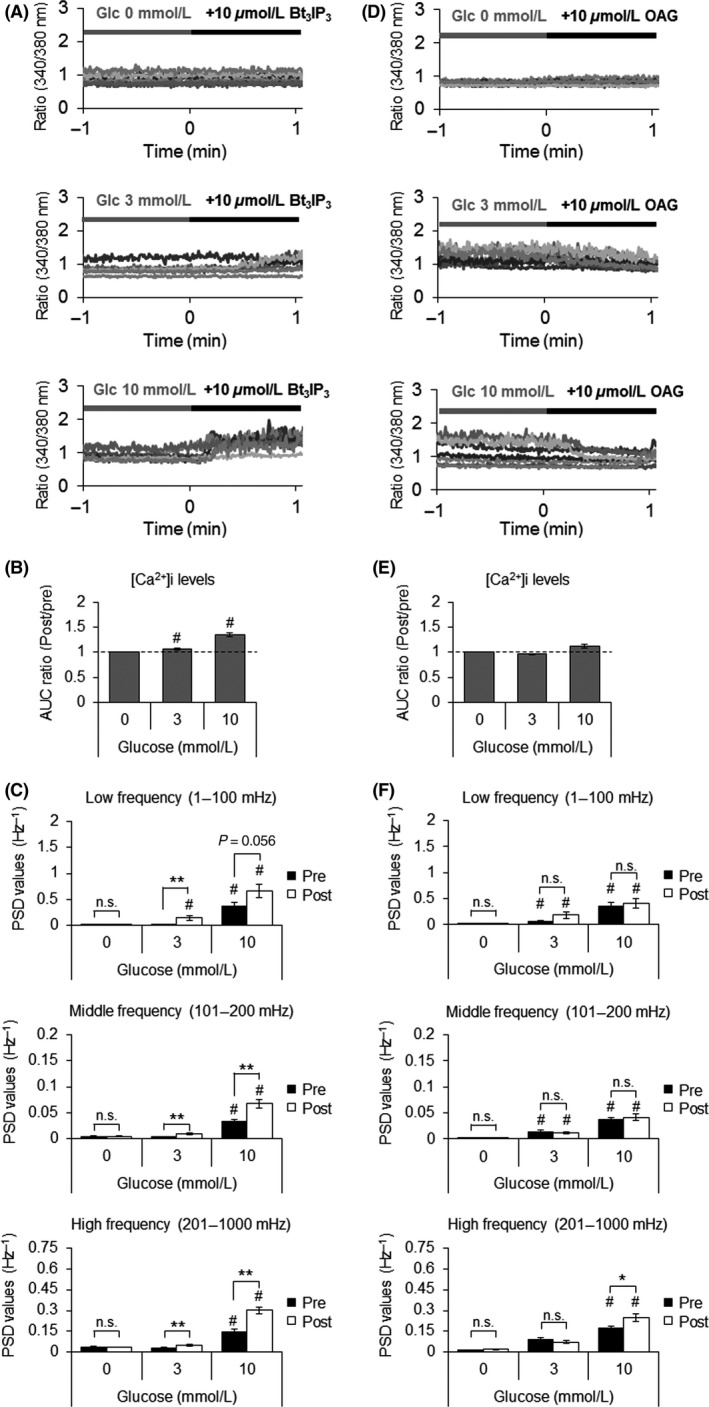
Figure 4.

Effects of Bt3IP3 and OAG on glucose‐dependent intracellular Ca2+ dynamics. Detailed analyzes of Ca2+ dynamics were performed in MIN6 cells loaded with fura‐2 AM and stimulated with (A–C) Bt3IP3 or (D–E) OAG. (A), (D) Representative traces in 21 regions of interest in one experiment at the indicated glucose concentrations. (B), (E) Changes in the intracellular Ca2+ response quantified by the area under the curve 1 min before and 1 min after stimulation. Data are presented as means ± SEM of 63 regions of interest within three experiments. (C), (F) Power spectrum density profiles describing the power of the oscillations at different frequencies generated by fast Fourier transform. The mathematical conditions are the same as in Figure 3. Data are expressed as means ± SEM of 63 regions of interest within three experiments. # P < 0.025 versus 0 mmol/L glucose by one‐tailed Williams’ test. *P < 0.05, **P < 0.01 by Welch's t‐test.
