
Figure 7.
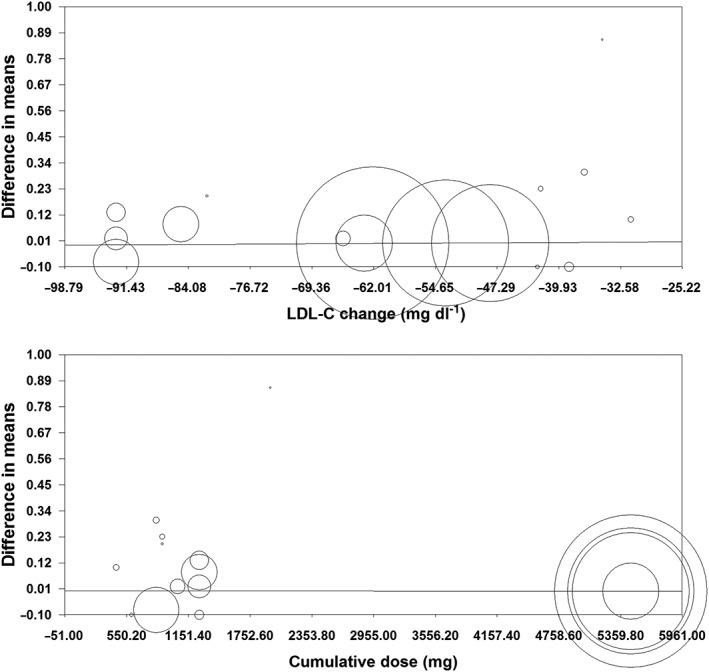
Meta‐regression plots for the association between mean changes in plasma high‐sensitivity C‐reactive protein concentrations with changes in plasma low‐density lipoprotein cholesterol (LDL‐C) concentrations (upper plot) and cumulative dose of proprotein convertase subtilisin/kexin type 9 inhibitor received during the course of the trial (lower plot)