
Figure 1.
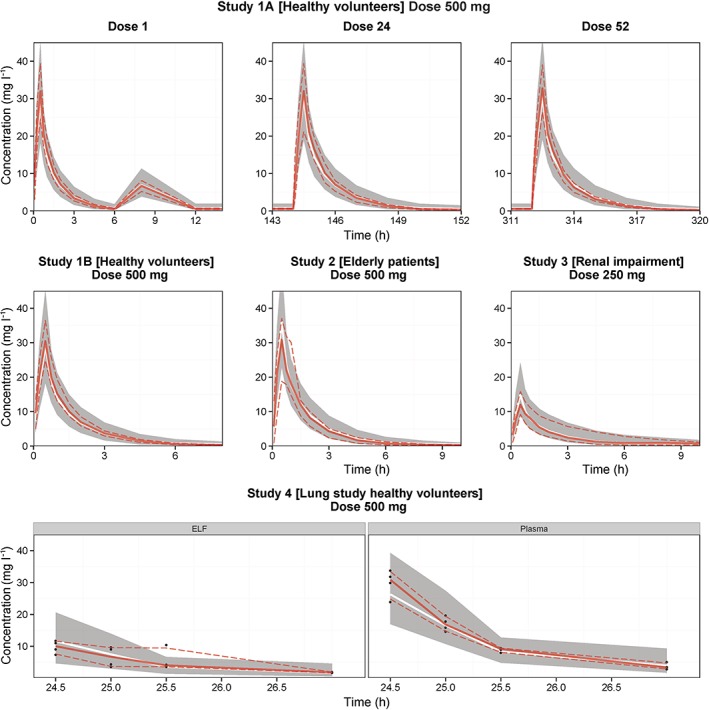
Visual predictive checks of the plasma and epithelial lining fluid (ELF) concentration–time profiles for imipenem, stratified by study. The solid lines represent the median of the observed data (red) and simulated data (white). The dashed lines and grey shaded areas represent the 5th and 95th percentiles of the observed and simulated data respectively. The design of these four studies is described in further detail in Table 2