
Figure 4.
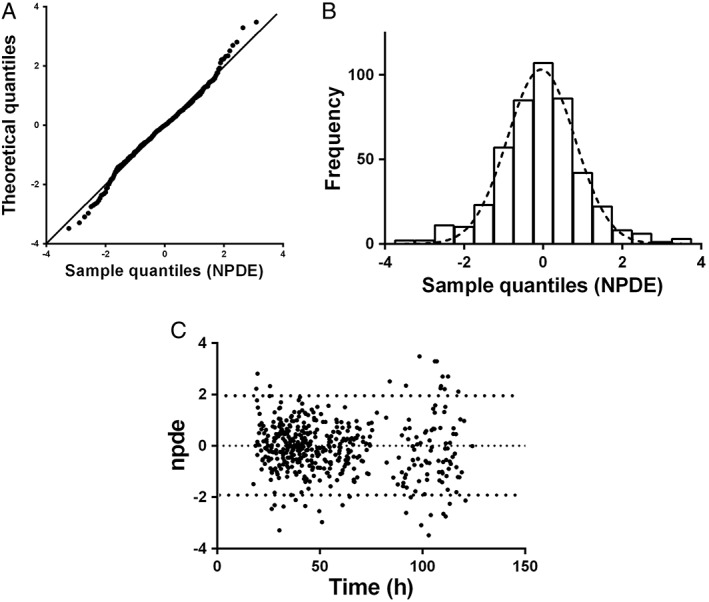
A) QQ‐plot of the metrics based on observations vs. the theoretical N(0,1) distribution. B) histogram of the NPDE distribution with the dashed line representing a normal distribution as a reference. C) NPDE vs. time (h)
Official websites use .gov
A
.gov website belongs to an official
government organization in the United States.
Secure .gov websites use HTTPS
A lock (
) or https:// means you've safely
connected to the .gov website. Share sensitive
information only on official, secure websites.
A) QQ‐plot of the metrics based on observations vs. the theoretical N(0,1) distribution. B) histogram of the NPDE distribution with the dashed line representing a normal distribution as a reference. C) NPDE vs. time (h)