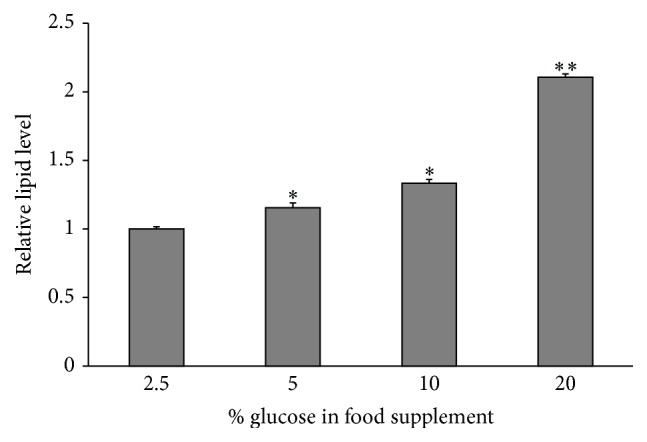
Figure 3.

Relative lipid level in transgenic flies fed different glucose diets. The lipid level was measured by the sulfophosphovanillin method and normalized with body weight. The lipid content increased with increasing glucose content in the food supplements. n = 30 for each treatment. The error bars represent the standard deviation. ∗ p < 0.05; ∗∗ p < 0.001.
