Figure 7.

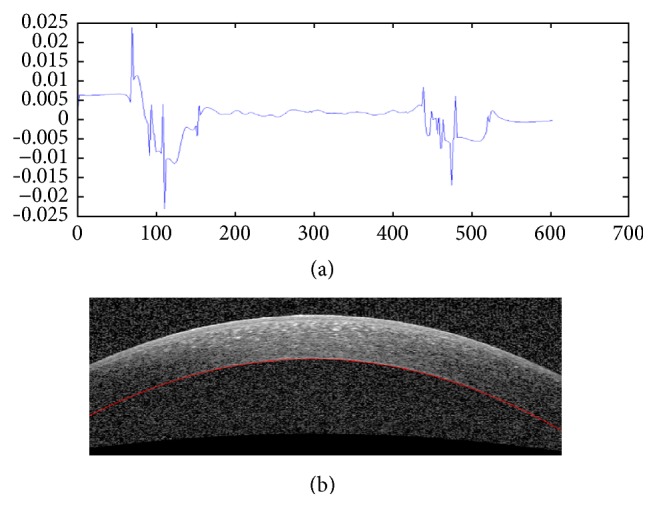
Extrapolation to low SNR regions. (a) The second derivative plot of Endothelium layer boundary to detect low SNR regions of this boundary. (b) Extrapolation result.

Extrapolation to low SNR regions. (a) The second derivative plot of Endothelium layer boundary to detect low SNR regions of this boundary. (b) Extrapolation result.