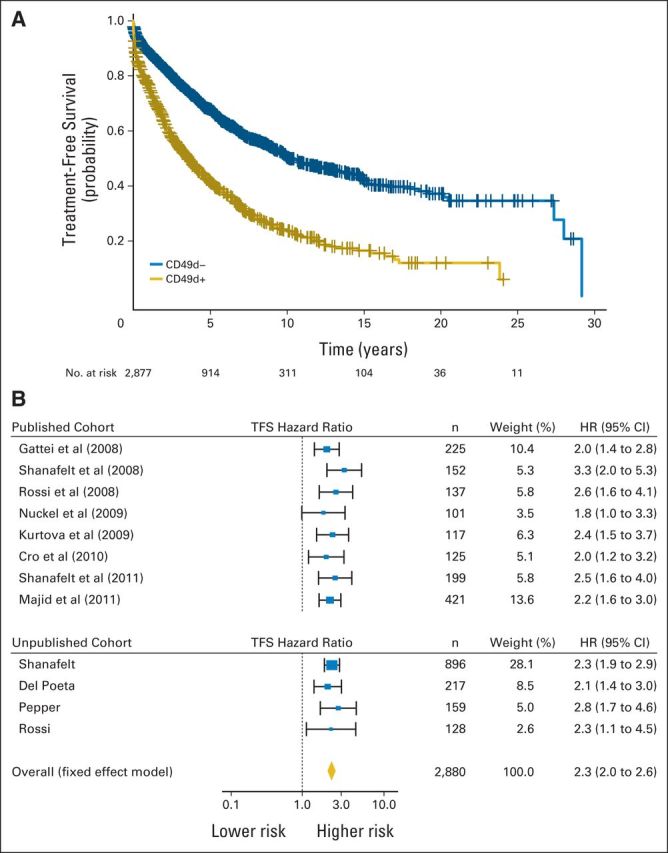
Fig 3.

(A) Kaplan-Meier curves of treatment-free survival (TFS) in individual patient data (IPD) for 2,880 patients; CD49d recoded at cutoff ≥ 30% (log-rank P < .001). (B) Forest plot of TFS hazard ratio (HR) in CD49d+ versus CD49d− patients (IPD for 2,880 patients; CD49d recoded at cutoff ≥ 30%). Solid boxes indicate HR in each study with dimensions proportional to weights (inverse of variance); horizontal lines indicate 95% CIs; diamond indicates pooled HR.
