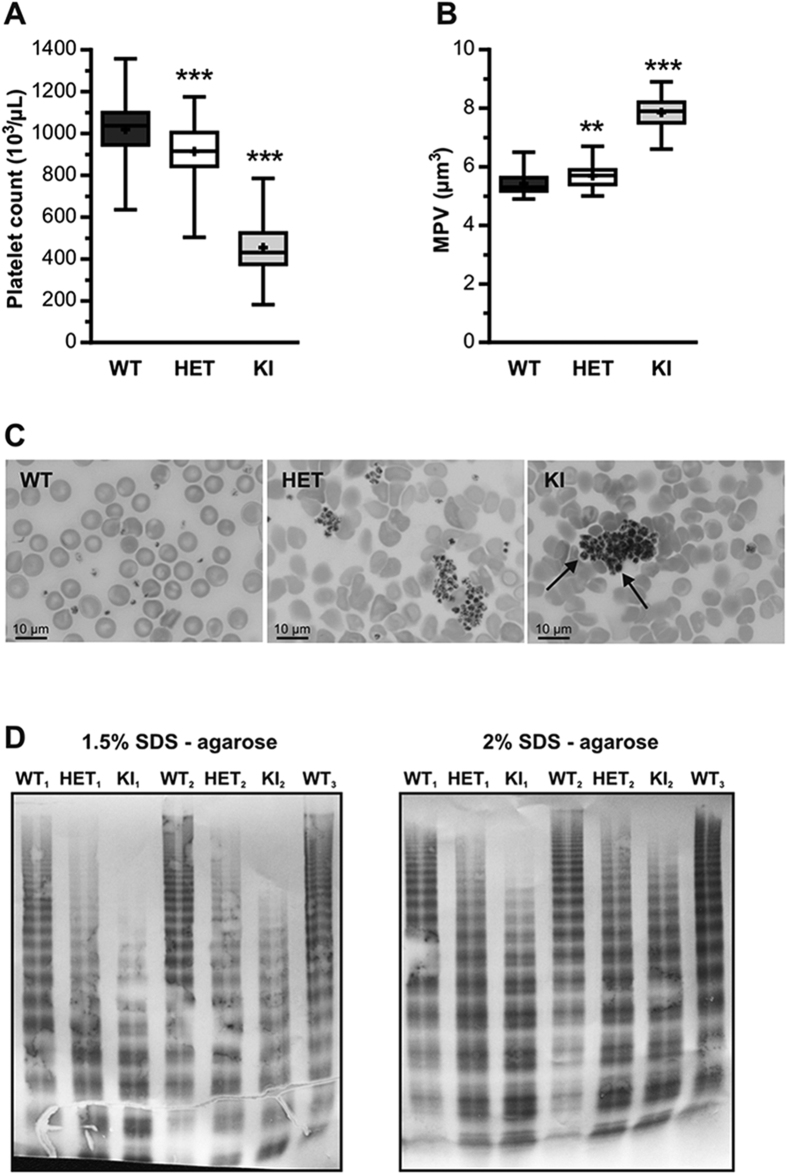
Figure 2. Platelet counts, blood smear analysis and VWF multimeric patterns of WT-, HET- and KI-mice.
(A) Platelet count and (B) mean platelet volume (MPV) were determined in WT (n = 58), HET (n = 73) and KI (n = 52) mice. Data are presented in a box-and-whiskers plot and statistical significance was evaluated by 1-way ANOVA followed by Dunnett’s test (**p < 0.01; ***p < 0.001). (C) Representative blood smears of WT, HET and KI mice after May-Grünwald Giemsa staining. (D) Multimer composition of circulating VWF proteins in WT-, HET- and KI-mice. Gels represent analysis of plasma samples using 1.5%- and 2% SDS-agarose electrophoresis.

