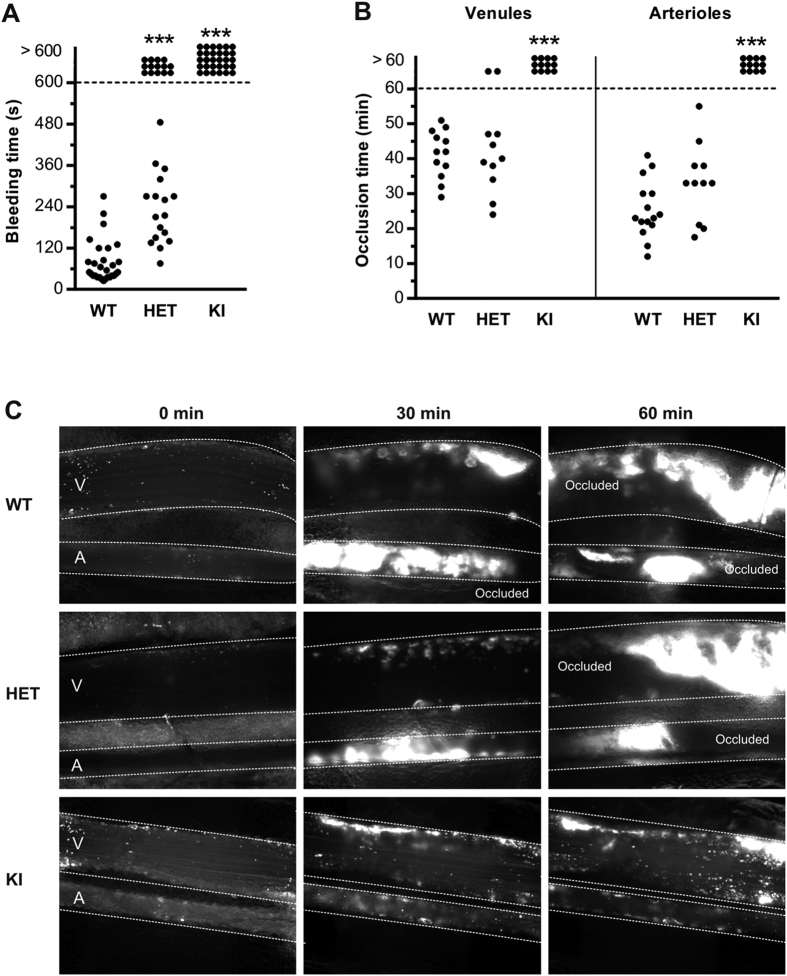
Figure 3. HET- and KI-mice display abnormal in vivo hemostasis.
(A) Tail bleeding time in WT-, HET- and KI-mice. Each dot represents one individual. (B) In vivo thrombosis model in mesenteric vessels (venules and arterioles) of WT-, HET- and KI-mice after FeCl3-induced injury. Adhesion and thrombus formation of fluorescently-labeled platelets were monitored by intravital videomicroscopy. Graph represents the occlusion time of the vessels. Statistical significance was determined by 2-tailed Mann-Whitney test (***p < 0.001). (C) Representative images of the thrombotic process in mice of the three different genotypes.

