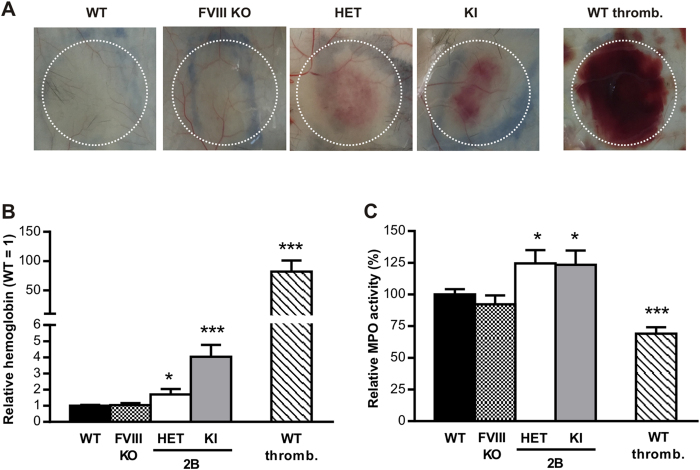
Figure 6. Reverse passive Arthus reaction.
Comparison of hemoglobin content (A,B) and leukocyte infiltration (C) in biopsies of the inflamed skin of WT-, HET-, KI-mice, FVIII-deficient mice (FVIII KO) and platelet-depleted WT-mice (WT thromb.) after 4 hours of the reverse passive Arthus reaction. In (A), representative photographs are shown. The results are expressed as relative hemoglobin to WT ± S.E.M (B) and as relative MPO activity to WT, given as 100% ± S.E.M (C) of 5–11 independent experiments. Statistical significance was determined by 1-way ANOVA followed by Dunnett’s test (*p < 0.05, ***p < 0.001).

