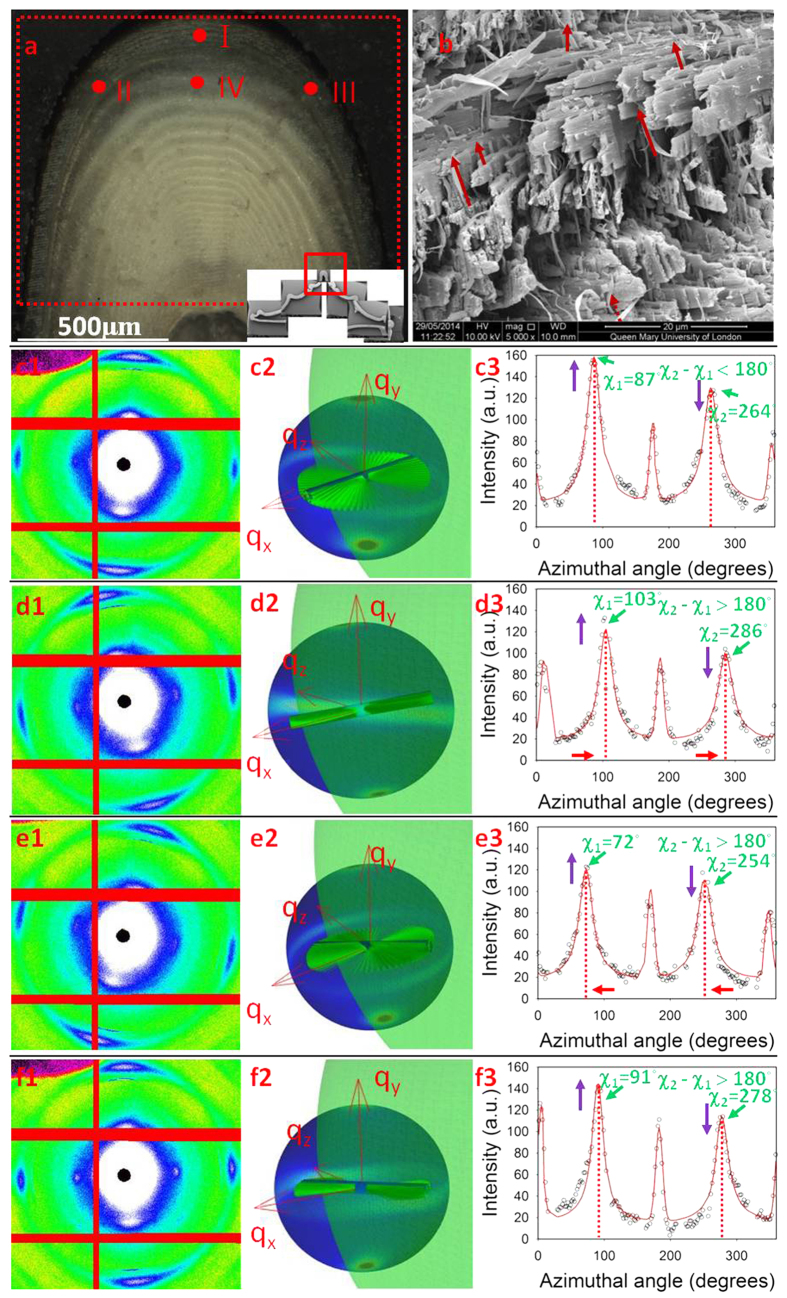
Figure 4. Comparison between experimental X-ray data and model predictions in different locations on the telson cuticle.
(a) Light microscope image of the adjacent section of the telson sample used in the synchrotron test. The inset image shows a low magnification SEM image of the cross-section of the entire telson. The locations where the example WAXD patterns used for fitting were indicated by I, II, III, IV. (b) A SEM image shows the plywood structure formed by the IP fibres and the OP fibres (indicated with red arrows) penetrate from the pore canals. (c1–f1) WAXD images collected in synchrotron experiments from location I, II, III, IV respectively, the 110 reflections were located within the read dash rings; (c2–f2) Diffraction intensity distributions on QS110 spheres plotted using the fitted 3D orientation parameters from location I, II, III, IV respectively; (c3–f3) Comparison of experimental and fitting I(χ) curves for each WAXD pattern collected from location I, II, III, IV respectively.

