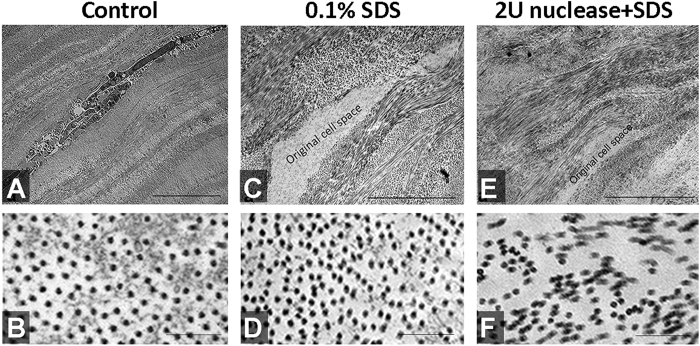
Figure 4. Fibrillar structure of lenticules.
(A,B) Control lenticule, (C,D) 0.1% SDS-treated lenticule and (E,F) 2 U/ml nuclease and 0.1% SDS-treated (2N + SDS) lenticule at low and high magnifications. (A,C,E) Transmission electron micrographs at lower magnification showing the global collagen fibril pattern and empty cell space after lenticule treatments by SDS and 2N + SDS, when compared to control. More regular fibril organization was observed in control and SDS-treated lenticules, whereas uneven compaction and irregularities were seen in 2N + SDS lenticule. Scale bars: 5 μm. (B,D,F) Images at high magnification showing the cross-sectional view of collagen fibrils. Scale bars: 200 nm.

