
Figure 4. Receiver operating characteristic (ROC) curves for the cumulative histogram analysis in the whole-slide prostate biopsy experiment.
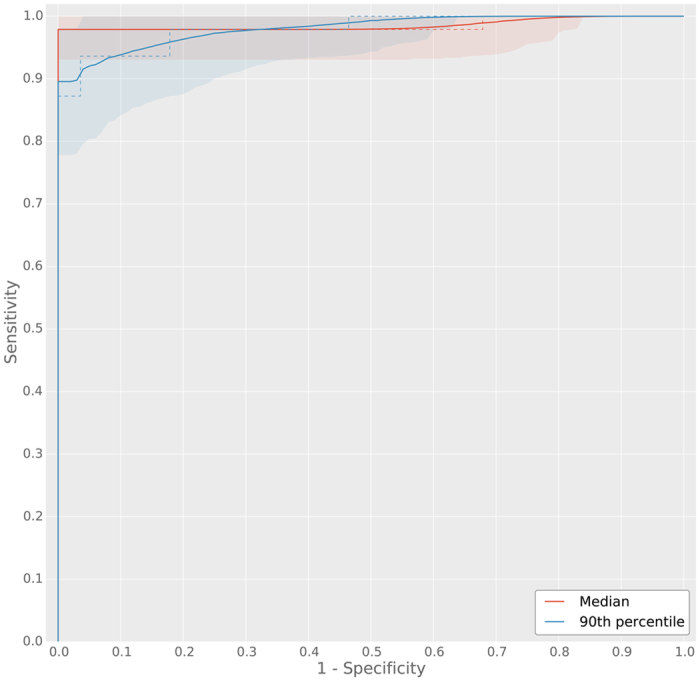
Two cumulative histogram parameters were used to obtain ROC curves, the median and 90th-percentile of the cumulative histogram of the whole slide images. The median ROC curve has a higher area under the curve (AUC), however, the 90th-percentile ROC curve shows higher specificity at high sensitivity. Solid lines indicate the mean bootstrapped ROC curve, the shaded areas indicate the 95th-percentile confidence intervals and the dashed line indicates the raw ROC curve.