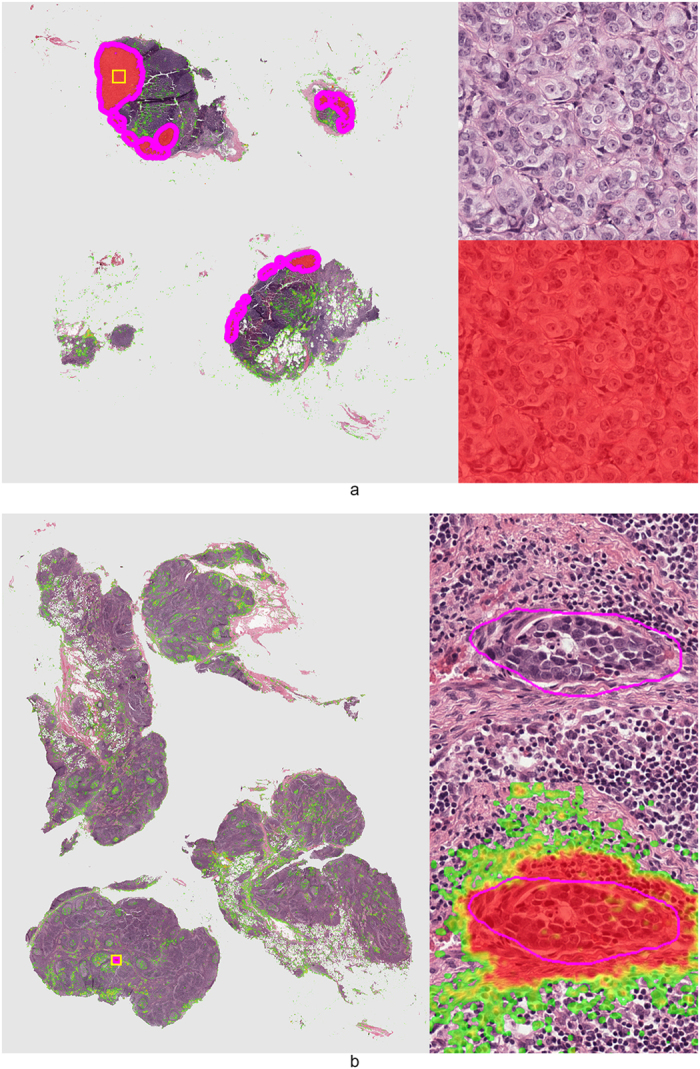
Figure 6. Representative examples of lymph nodes with macro-metastases (top image) and a single micro-metastasis (bottom image) from the test set.

Metastases likelihood maps are overlaid on the original H&E image. Transparent/green means a low likelihood, whereas red indicates a high likelihood of metastasis. Magenta contours indicate the ground truth annotation. On the right side of the whole slide images the areas indicated by the yellow squares are shown at full-resolution.
