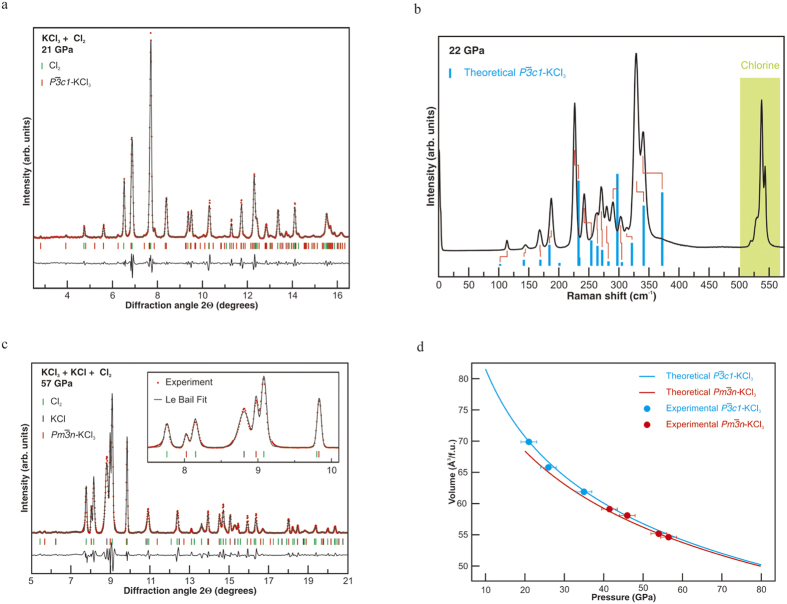
Figure 3.
Experimental evidence for KCl3: (a) XRD pattern of P  -KCl3 and Cl2 at 21 GPa. (b) Raman spectrum of P
  -KCl3 and Cl2 at 22 GPa. Blue bars show computed spectral positions and intensities; Red ticks represent tentative assignment of the theoretically predicted Raman modes with the experimental data. (c) XRD pattern of
  -KCl3, KCl, and Cl2 at 57 GPa. (d) Experimental and theoretical pressure-volume equations of state of P
  and
and  -KCl3. In (a,c) black lines show the intensity difference (Iobs − Icalc), Le Bail refinement residuals are Rwp = 0.139 and Rexp = 0.096 in (a) and Rwp = 0.233 and Rexp = 0.151 in (c). X-ray wavelengths are 0.3100 Ǻ in (a) and 0.3344 Ǻ in (c).

