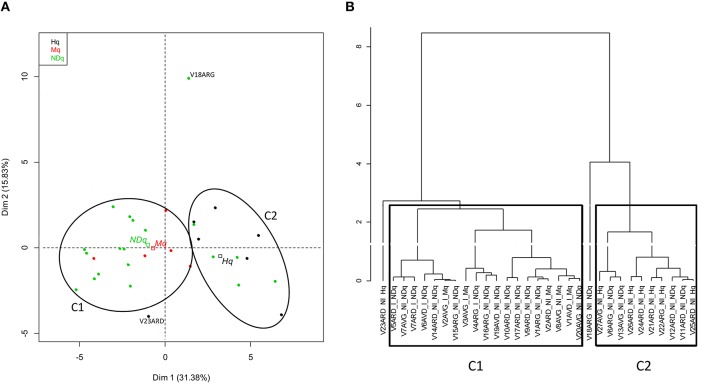
Figure 3.
Principal Component Analysis and hierarchical clustering on bovine teat taxonomic profiles. PCA was performed on an abundance table combining taxonomic levels L2 and L6. (A) Individual factor map. Samples are indicated by points and colored with regard to quarter health status. Centroid positions are indicated by squares for quarter status (Hq, Mq, NDq); (B) Hierarchical clustering of samples according to ACP results. All samples but one (V23ARD), classified as healthy quarters (Hq), are clustered together (C2), whereas all samples that have already developed mastitis (Mq) and those that display an infected microbiological status (I) are clustered together (C1).

