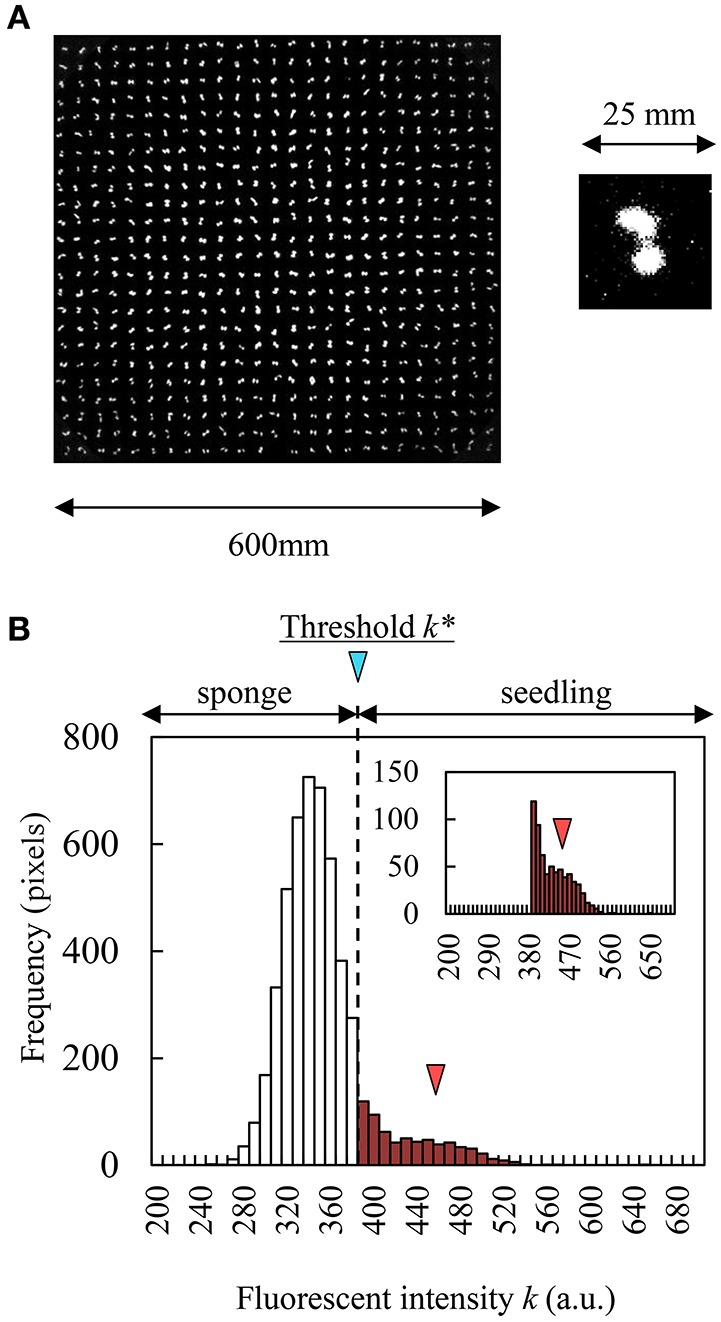
Figure 2.

CF obtained by CCD camera and histogram of fluorescent intensity in a seedling and sponge image. (A) Grayscale CF image of 600 seedlings (contrast changed). (B) Histogram of fluorescent intensity of sponge (white bars) and a seedling (red bar). Red triangle indicates the peak of histogram in a seedling.
