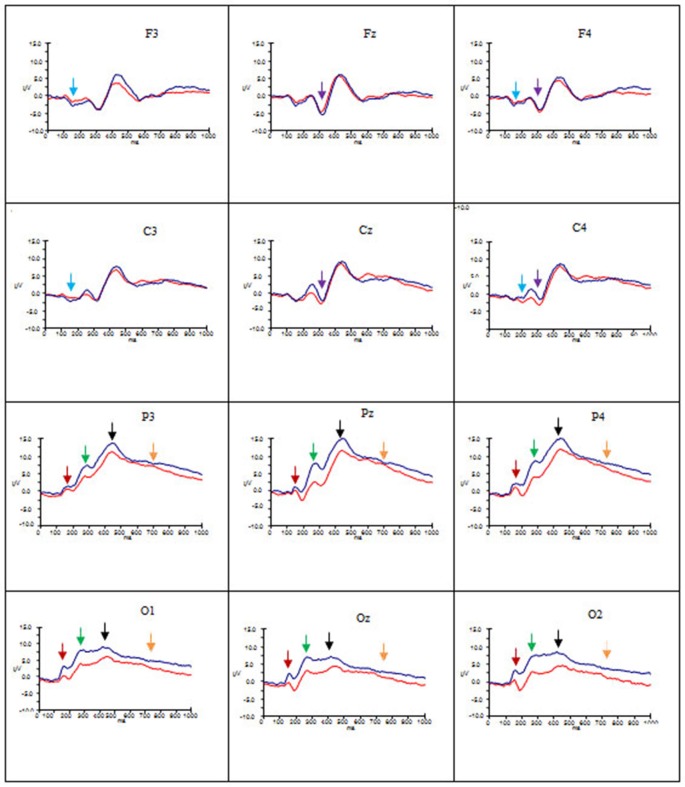
Figure 2.
Grand average ERP’s for AA for artists (blue) and non-artists (red). Time 0–1000 ms, at selected frontal, central, parietal and occipital sites. Scale −10 ±15 μV. P1 component indicated by dark red arrow  ; N1 component indicated by light blue arrow
 ; P2 component indicated by green arrow
  ; N2 component indicated by purple arrow
  ; P3 component indicated by black arrow
  ; Late Positive Potential (LPP) indicated by gold arrow
  .
.

