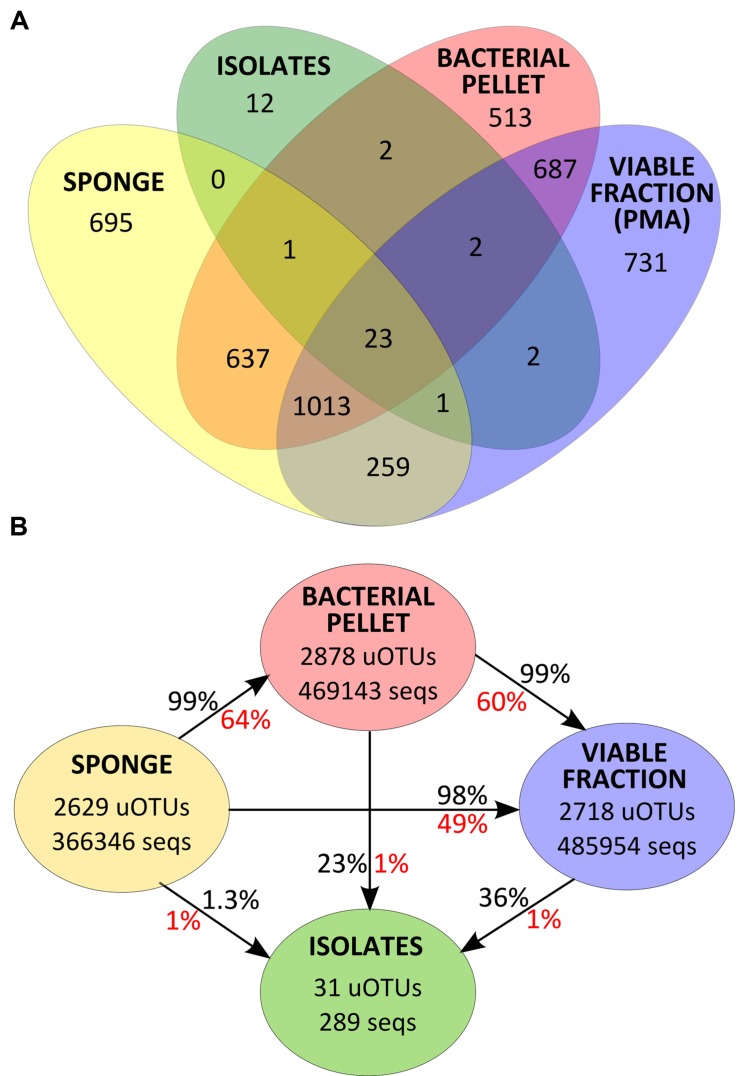
FIGURE 4.
(A) Venn diagram for uOTU distribution of v4-16S rRNA gene sequences at 97% similarity for each sample group. (B) Total number of v4-16S rRNA gene sequences and uOTUs at 97% similarity in each sample group and percentage of diversity (in red) and abundance (in black) recovered after each sample processing step.

