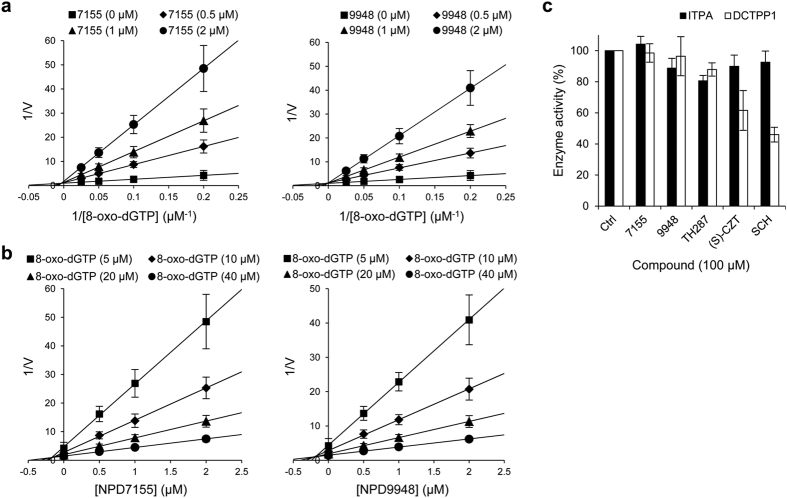
Figure 2. Kinetics and selectivity of NPD7155 and NPD9948.
(a,b) Kinetic analysis of NPD7155 (7155) and NPD9948 (9948) against MTH1. Lineweaver–Burk plot of reciprocal of initial velocity vs. reciprocal of varying 8-oxo-dGTP concentrations (a) and Dixon plot of reciprocal of initial velocity vs. varying concentrations of NPD7155 or NPD9948 (b). Data are shown as mean ± s.e.m. from three independent experiments. (c) Effects of NPD7155, NPD9948, TH287, (S)-crizotinib [(S)-CZT], and SCH51344 (SCH) on the catalytic activities of ITPA and DCTPP1 in vitro. Data are shown as mean ± s.d. from three independent experiments.

