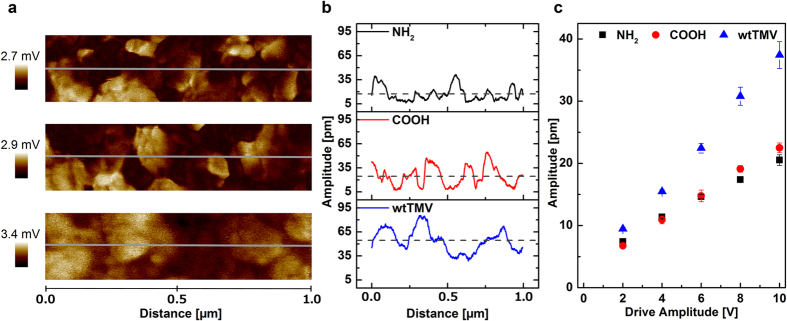
Figure 4. Piezoelectric Properties in Dependency of the Used Template.
(a) Amplitude images of the PFM measurements performed at 10 V for NH2-based films (top), COOH-based films (middle) and TMV-based films (bottom). (b) Corresponding amplitude profiles taken along the grey lines in (a) are shown for each template. (c) Linear dependency of the vertical amplitude signal on the drive amplitude for each film. Data points correspond to mean values of five individual measurements. Error bars show the standard deviation from those mean values.

