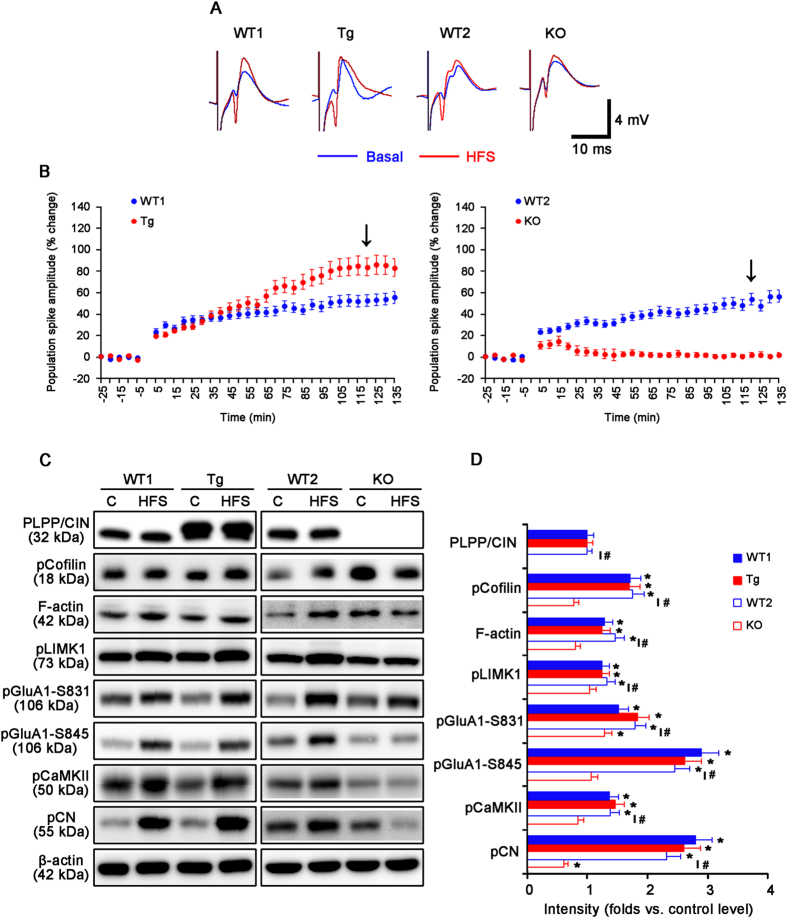
Figure 2. Profiles of LTP induction induced by HFS.
(A) Representative traces of LTP induction in the dentate gyrus. (B) The quantitative analyses of the LTP induction. As compared to WT animals, Tg mice show enhanced LTP induction, while KO mice exhibit disrupted LTP induction (p < 0.05; n = 10, respectively). Error bars in graphs indicates SEM. Arrows indicates the time point of representative traces. (C,D) Western blot analysis of the efficacy of LTP induction. HFS increases F-actin level and phosphorylation levels of cofilin, LIMK1, GluA1, CaMKII and CN in WT and Tg mice. In KO mice, HFS increases pGluA1-S831 level, but reduced pCN level (*p < 0.05 vs. control level, #p < 0.05 vs. WT animals; n = 10, respectively). Error bars in graphs indicates SEM.

