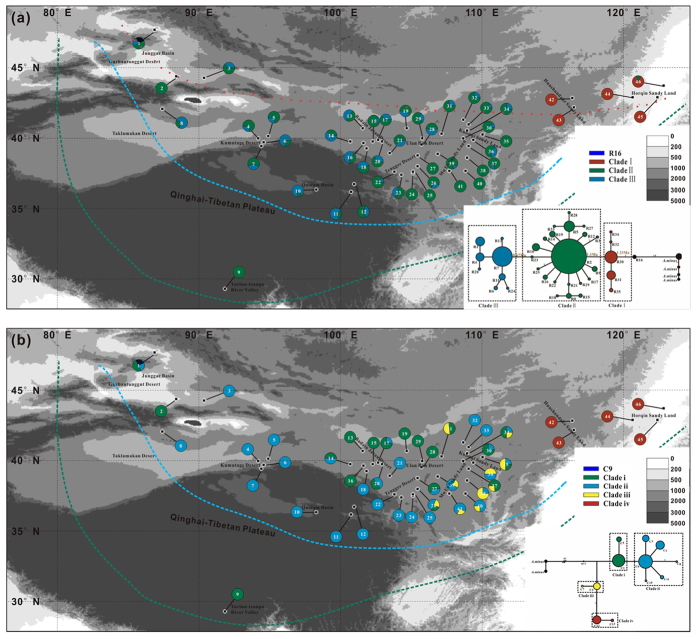
Figure 1. The distribution of haplotypes in the geological locations and Median-joining networks of the haplotypes in the 46 A. squarrosum populations examined in this study.
(a) nrITS ribotype distribution and genealogy topology; (b) cpDNA chlorotype distribution and genealogy topology. Population locations are presented as small black spots on the map, and the slice size is proportional to the frequency of the haplotypes (different clades). The colours of the pie-diagrams correspond to clades of the network genealogies at the bottom of the two maps. The sizes of the circles in the genealogy topology correspond to the frequency of each haplotype; each number near the line represents the mutational steps interconnecting two haplotypes, and only the steps over two mutations are listed. The red dotted line represents the first wave of colonisation, the green dashed line represents the second wave of colonisation, and the blue dashed line represents the third wave of colonisation. These figures originated from the software packages of Diva-GIS version 7.5.0 (http://www.diva-gis.org/), and then modified by Q,C.J. with CorelDraw X6 (Corel Corporation, Ottawa, Canada).

