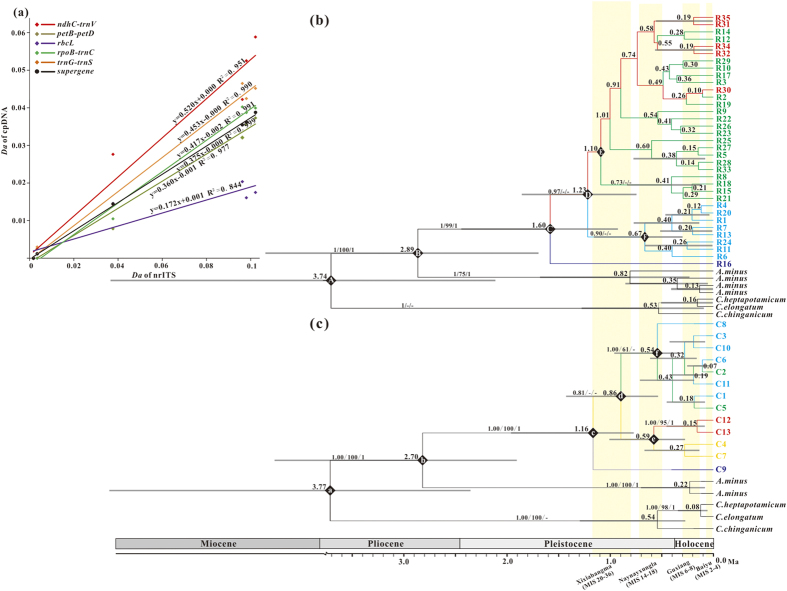
Figure 2. Beast-generated maximum clade credibility tree of 35 ribotypes (R1-R35) and 13 chlorotypes identified in A. squarrosum and haplotypes in outgroups.
(a) The correlation of divergence between different species for the nrITS, five chloroplast fragments and the supergene separately: x-axis, Da of nrITS; y-axis, Da of chloroplast fragments. Different colours represent different chloroplast fragments; (b) BEAST tree estimated using the ribotypes; (c) BEAST tree estimated using the chlorotypes. The numbers adjacent to the nodes indicate bootstrap percentages from BEAST, ML and BI. The symbol - indicates that the analysis does not support this branch. The node age (Ma) estimates are marked by letters; a-f represents the coalescence time of each major clade, and the length of the grey bars represents the 95% highest posterior density.

